Process Points. 8.21.
Lesson of the Week: Variance or Process?
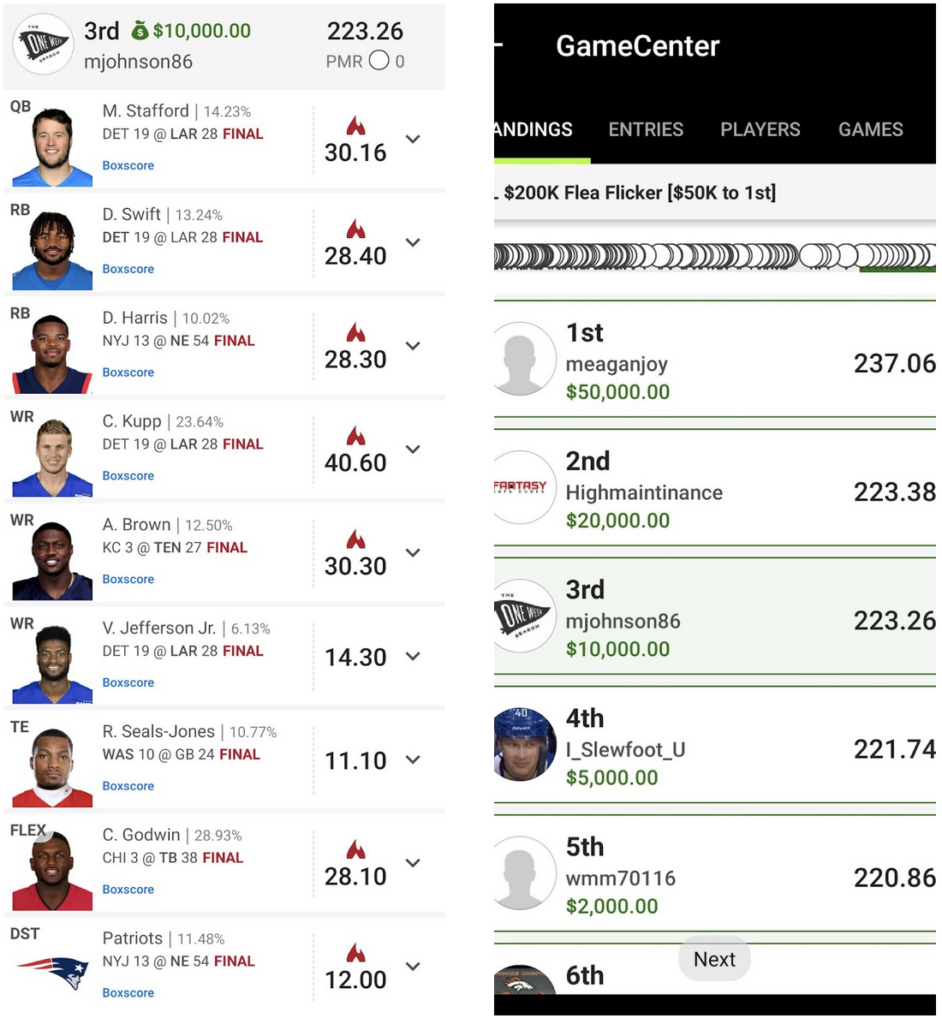
We are getting to the point in the season where it can be very frustrating if you haven’t seen success yet. Inevitably, there will be questioning of the process and wondering if you are just “running bad” or if there is something wrong with your play/process. It is a fair question and one that a lot of people are facing. If you aren’t already, I strongly suggest you join the OWS Discord and specifically check out the Reflection channel. There is some excellent conversation happening there on Mondays. Xandamere and I went pretty deep on Monday about some of the specifics in evaluating play. I think it would benefit a lot of people to understand the numbers. This was a terrific week for me as I had a lineup take 3rd in the $5 Flea Flicker on DraftKings for $10,000. Let’s dive into that lineup and explore it from the lens of “Variance vs. Process,” looking at some of the critical concepts to understand when evaluating your play.

Obviously, this was a great score for me, but if you watched the end of the Lions/Rams game, you know that the game ended on an easy dump off to D’Andre Swift that hit him in the hands, bounced up in the air, and was intercepted. The person who took 2nd place did not have Swift. This means if he just catches the ball, I would have taken 2nd place and won $20k instead of $10k. A $10,000 swing on a dropped pass — what a bad beat!! Actually, it isn’t that simple, and looking at it that way doesn’t tell the full picture. I also had Chris Godwin on this roster. Godwin was sitting at 7/96/1 receiving in the 4th quarter with the Bucs up 38-3. The Bucs got the ball back with 7:58 left and took out all of their offensive starters — except Godwin. On 2nd & 7, they ran a WR screen for Godwin that he took for 15 yards then immediately went off the field with a smile on his face. Clearly, the Bucs staff knew how close he was to a 100-yard game and put him in just for that purpose. That play was worth 5.5 points between the production and a 3-point receiving bonus. If the Bucs left him on the sidelines (as most teams would), I would have finished 7th for $1k — a $9,000 swing. The point here is that usually, we focus on the things that go wrong or hurt us, but rarely do we consider those things that went our way that shouldn’t have.
From the standpoint of Variance vs. Process, you should be evaluating your process by what percentage of your lineups are finishing in their respective percentiles. For instance, if you are a perfectly average player, you would expect 1% of lineups to finish in the top 1%, 5% of lineups in the top 5%, 10% of lineups in the top 10%, and so on. What that means is for every 100 lineups you make, a player who is “even with the field” would expect to have one lineup finish in the top 1%. You are then relying on variance and things bouncing your way in those few spots where you make it into the top 1%. The best DFS players in the world struggle to get more than 2% of lineups into the top 1% threshold, which also seems low — but if a poor DFS player is finishing in the top 1% in only 0.5% of their lineups, that means the top players are getting 4x as many chances for variance to hit them just right. Along with this, it is important to understand that these numbers are going to tell you more as the sample size increases. If you are a “2% of lineups finishing in the top 1%” type of player, but you only play three lineups per week, that is 54 lineups per year — meaning you’d only expect one roster all year to finish in the top 1%. The lesson here is that if you don’t have the time or means to play an extremely high number of lineups, you simply aren’t going to have enough data to be able to tell if it’s you or you’re running bad. This is where you have to “trust the process”…..
- Do your lineups have good correlations?
- Are you attacking the right game environments?
- Is your player pool condensed enough that you are likely to get paid off if you are “right” in a week?
- Do you understand game theory and ownership situations?
- Do your lineups have enough differentiation for your contests without playing “bad plays”?
These are the kind of questions you should be asking yourself to determine how sound your process is. I’ve had two big scores this season that if one or two things break differently, I easily could have finished 5th and 7th instead of 1st and 3rd. My returns would look much worse right now, and I’d actually be down on the year — but that wouldn’t mean my process was worse than how I look at it now just because things broke my way. Process gives you a chance (over a large enough sample), and Variance decides if you get the big payday for it or wait for the next chance. This is the essence of GPPs.
Lineup Reviews
As outlined in my +EV Primer course (you can find in the Marketplace – either by itself or in the bundle with my player pool course), one of my approaches that keeps me from getting too high or low week-to-week is playing consistent contests and approaching them from a season-long perspective and using that to evaluate my play and ROI. This season, in this article, I will be tracking my progress on a weekly basis as I play the Single Entry (SE), 3-max, and 5-max tournaments in the $20 to $150 price range on DraftKings main slate for all 18 weeks. Rather than sweating or worrying about my ROI every week and “hoping to cash,” – my goal for the season is to maximize profit relative to that long-term investment total. The results of a given week are irrelevant.
Each week I will review the best and worst of my 11 lineups from my “Roster Block” of SE/3-Max/5-Max. Below are this week’s results, and you can find more information about my process/theory for this in my Week 1 Process Points article.
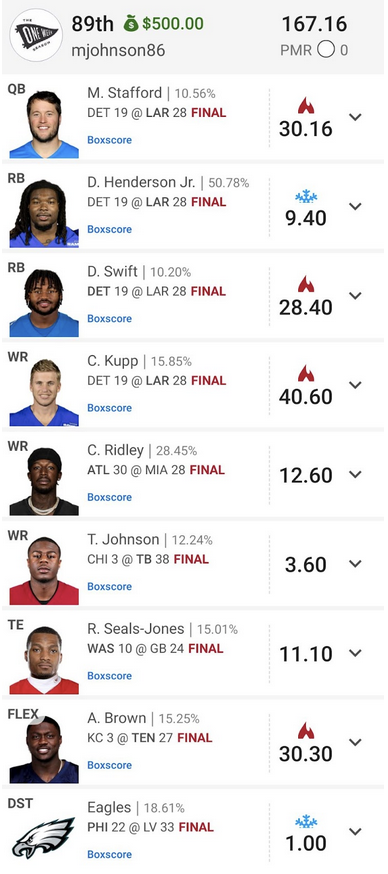
Best Lineup ($150k Double Spy, Single Entry, $200)

The “story” I was telling: Some may look at this lineup and think it is “too chalky” or has too high of ownership, as all nine spots have double-digit ownership. However, it’s important to consider how those pieces work together and the ownership they have combined. The Rams trio of Stafford/Henderson/Kupp had just smashed in a similar matchup the week prior against the Giants, and Swift was the most obvious Detroit skill player to use as a bring-back. Given their individual ownerships and recent history, most would likely think this was a popular grouping. However, that four-player group was used in only 0.11% of lineups in this contest. The Double Spy was an 833-person contest, so what that means is this was the only lineup in the contest which had this grouping (Shout out to Jesse Friedland for his awesome “Ownership Analyzer” tool!). The other four spots were filled out with individual pieces I was high on as floating plays for the week, and given the uniqueness of my core stack, I didn’t really take ownership into consideration at all for those other pieces.
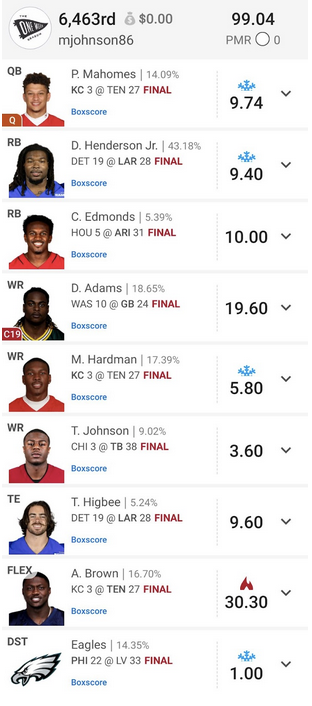
Worst Lineup ($200K Three-Point Stance, 5-max, $33):

The “story” I was telling: The biggest thing to take away from this roster is the story it tells about the slate. There were six teams on the main slate that had team totals of 27 or higher, and every one of my skill players was from one of those teams. I built my main stack around KC/TEN — the highest game total by a large margin — and had a piece of each of the other four offenses. While the results weren’t there, I had access to all the best spots through high usage players for their price tag and also managed to have three players who were single-digit ownership. I didn’t need anything crazy to happen for this roster to pay off. I just needed the games to play out as expected, with the scoring playing out in my favor.
Week 7 Results: I only played ten rosters this week instead of 11, as I bumped up to play the $200 Double Spy this week. I only cashed one of the ten rosters, but luckily it was that highest-priced entry, which made it an alright week for the roster block.
Week 7 Investment: $792
Week 7 Winnings: $500
Estimated Yearly Investment: $14,000
Yearly Winnings: $2,730
