Our partners at StatRankings built this preview for the OWS community: what they project for 2026, what actually happened in 2025, and where their numbers disagree with the market.
Think of it as the DFS player’s prep. Every coordinator and play-caller change, offseason signing and departure, camp note, O-line grade, win total, and implied point total for all 32 teams. Know who’s calling the plays and what changed before Week 1 slates lock, and you’re already ahead of the field.
Inside:
Rankings & ADP: Top 250 for Underdog and DraftKings, including where their rankings differ from the market. Compiled by @MagicSportsGuy (BBM top-20 finisher) and @SC_FFB (top-1% advance rate across 450+ BBM teams).
2026 Projections: Built from the game down—team volume and efficiency first, then every player’s share of it.
Hilow’s Best Ball Takes: Team-by-team analysis from OWS’s lead DFS analyst and game theory expert.
Advanced Analytics: PROE and PROE+, Defensive Pressure Rate Over Expected, EPA, target distribution, ARBY, and xFP leaders.
We have had four years of the Drafters Main Event in its current form and since it has become more of a large field and mainstream contest. We also have data from the last three seasons of the “Drafters Mini” contests at a much lower price point (it has fluctuated between $2 and $3). The accumulation of results from the past contests is as follows::
As the site has grown in popularity and prize pool, the field has gotten somewhat sharper and there is a bit more focus on things than there was when the contest first opened. As those things happened, the winning scores have progressively increased but are likely hitting a plateau. However, what we can see is a trend in terms of overall results across these contests. The data across multiple years of these contests in the cumulative scoring format shows us that a team with roughly 2,800 points almost certainly will land us inside the top-10 of a given contest and gives us a legitimate shot at winning the whole thing. This is the basis from which our strategy on Drafters must begin and provides an understanding of exactly what we are trying to achieve when we draft teams. This is a completely different animal than the playoff format contests that other sites offer, and we must adequately and appropriately adjust to reflect that. This leads us to our next concept: Positional Silos.
Drafters :: Positional Silos
WRITTEN BY: MIKE JOHNSON (@MJOHNSON_86)
Now that we know what our target is (2,800 points), the question becomes; “how do we get there?” This is where our deep dive into this format really gets going as we must think of these contests far differently than the playoff formats on Underdog and Draftkings.
On those other sites, the goal is simply to survive the first 14 weeks with an above average lineup that beats at least 10 of the other 11 teams in your drafting pod. Once you have accomplished that, the goal is to have high ceiling (and ideally healthy) players, with some correlation mixed in to maximize weekly upside as these individual weeks have far greater importance than the first 14 weeks and ultimately determine whether you are profitable or not. There is an element of “pod luck” involved in those contests as well (for example, one team could score 160 points in Week 15 and win their pod/group while another team could score 190 points and finish second or third in theirs), which is out of our control. In the simplest of terms, the goal in those contests is to be good for the majority of the season and then have maximum single week upside within your roster for the stretch run and hope for the best. There are a lot of strategies and concepts that can be taken for that format, but many of those are irrelevant or far less optimal in the cumulative scoring format.
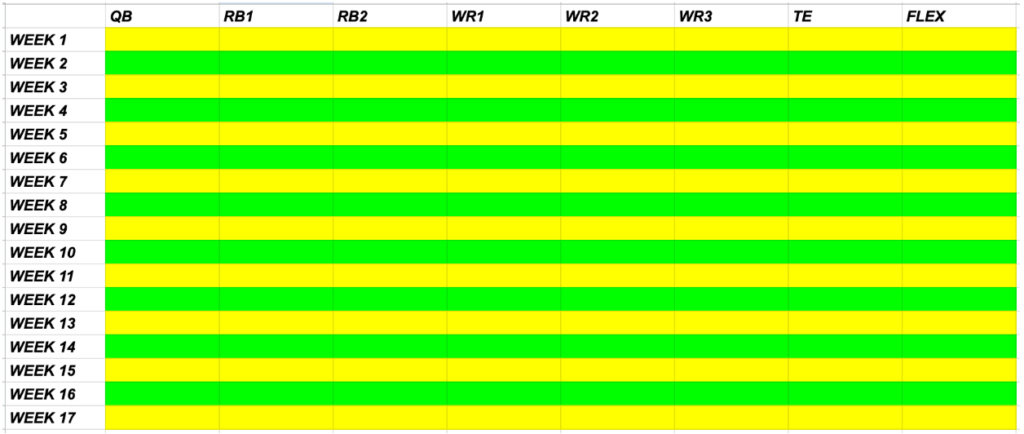
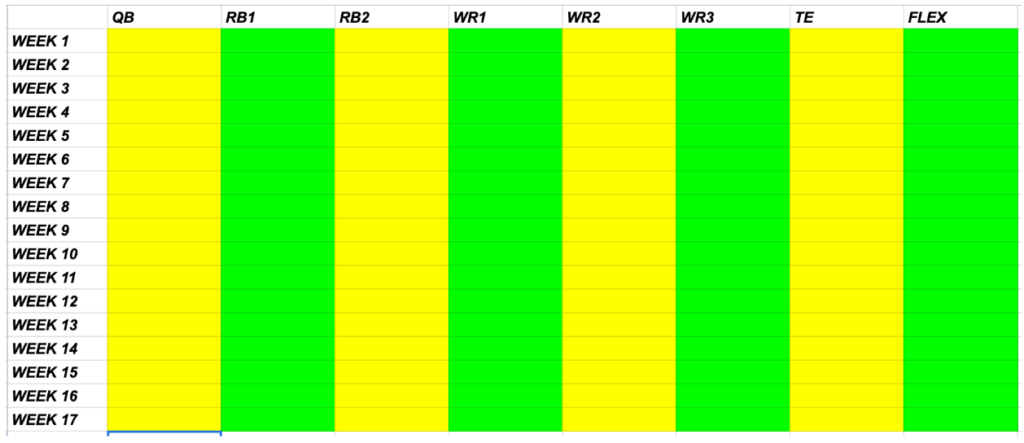
With all of that in mind, the next thing we must acknowledge and understand is that scoring for all of the weeks is equally important and that having a high scoring week in any given week doesn’t really carry any added weight. Therefore, how should we be looking to build our rosters? If the “traditional” Best Ball formats encourage focusing on weekly scoring that isn’t as valuable in this format, then on Drafters we should be flipping the way we look at things. I do that through the lens of a concept I call “Positional Silos”. To help you understand what I mean, below are two visuals that help to explain things. The visuals are grids depicting the 17 weeks of the Best Ball season and the eight positions that count towards your score each week. The first shows how most people view Best Ball, through a horizontal/weekly perspective (highlighted in yellow and green). The second shows how we SHOULD view things, through a positional/vertical perspective.
The reason that we should view things through the “Positional Silos” perspective rather than the weekly perspective is simply control. As discussed earlier, a high score in any individual week is irrelevant and over the course of 17 weeks everything tends to even out. It is impossible to plot out things from a weekly basis, and how things come together in that regard is just out of our control (similar to “pod luck” in the other format). What we DO have control over is how we construct our rosters and understanding the historical relationships between ADP’s at the various positions and final results in terms of positional rankings and optimal draft capital allocations.
Now we know that 2,800 points is our target. And we know that we should be looking at things from a “Positional Silos” perspective. So what does that mean? Well, there are eight positions that count towards our score weekly. So we can simply divide 2,800 by 8, which gives us 350 points. This means that we are looking to have each silo contribute 350 points. Obviously, that is not going to be evenly distributed (the WR1 position will obviously score much higher than the WR3 position), but seeing things from that perspective helps us to understand how we are constructing our lineups. Likewise, our target for the QB position is generally around the 400 point range (we will get into this in the QB chapter), while if you are able to get around 300 points from the TE position you are in really good shape. So the targets for each specific “position” may vary, but we should operate with that in mind – that 350 points per silo is the overall target for 17 weeks.
Side Note: While we look at things from the perspective of “Positional Silos” with eight positions in mind, it may be helpful at the RB and WR positions to look at things from the perspective of one bigger silo rather than multiple individual ones. So for the RB position, a wider “silo” of two positions that we are targeting 700 points from across the 17 weeks (so 34 total scores from the RB positions). The same for WR, where the “target” would be 1,050 points in total from the three WR slots (51 total scores).
If you want to take this thought process a step further, we can divide the 350 points per silo by the 17 week season (350/17). This gives us 20.6 points per week from each of your eight positions as your target. Again, we don’t expect to have eight players score 20.6 points each week and it will normalize itself across the season, but knowing that number is critical because it can keep you from something that I think many people do incorrectly – which is placing too much value on “steady” or “consistent” players who lack weekly upside. This leads us to the next critical concept that we must understand in order to optimize our Drafters rosters: “Usable Weeks // Points Added”.
Drafters :: Usable Weeks (Part 1)
WRITTEN BY: MIKE JOHNSON (@MJOHNSON_86)
We ended the explanation of “Positional Silos” with this statement: “Again, we don’t expect to have eight players score 20.6 points each week and it will normalize itself across the season, but knowing that number is critical because it can keep you from something that I think many people do incorrectly – which is placing too much value on “steady” or “consistent” players who lack weekly upside.” We will pick up right where we left off to discuss why that idea is important to understand.
These players who may project well across the season due to their ability to accumulate stats but rarely, if ever, put up 20 points in a week are the most overvalued players in this format. Most of the field thinks “well if Player X scores 200 points this season and we need around 2,800 total, he’s an awesome pick!!”. But if he only cracks your lineup a couple of times throughout the season because he is just posting 10 to 15 points every week at RB or WR, he’s not actually increasing your chances of *WINNING* the tournament. These players do carry some value, especially on specific types of rosters, as it is also important to avoid very low scores in any Positional Silo in a given week (a few sub-5 point scores over the course of the season can crush a roster that may otherwise contend), but many of these types of players have alternatives available with later picks that are likely to contribute to your roster in an equal or greater fashion. Here is an example from 2025 of what I mean::
Player A is a running back and had an ADP in the 7th round. He was on an offense that is viewed by consensus as one of the top-10 offenses in the league. In 2024, he scored in double digits in 76% of his active games and scored 19+ points four times.
Player B is a running back and has an ADP in the 12th round. He is on an offense that is viewed by consensus as one of the top-10 offenses in the league. In 2024, he scored in double digits in 67% of his active games and scored 19+ points three times.
Player A was Aaron Jones (MIN) and Player B was Rachaad White (TB). Both players had competition for touches within their roster, but Jones was older and had a less certain projection from the QB play on his team.. In a vacuum, Jones was still a better fantasy option entering last year than White, but from a “Positional Silos” perspective, White was essentially the same type of player going several rounds later. Jones scored more points Now maybe this example doesn’t hit home for you specifically, as you may have been high on the Vikings offense and Jones last year or maybe you were ready to write off White and expected Bucky Irving to dominate the backfield – but the concept is wildly important to be aware of and understand when drafting teams. You can be “right” about a player having a “good” season, but how much are they really helping you. That is where the “Usable Weeks // Points Added” concept comes into play.
Usable Weeks
In the simplest terms, a “Usable Week” is defined as a week in which a player’s score counts towards your lineup. There are 17 weeks in a season and each player will have a bye week during that stretch, so how many of those is a player contributing in? How many should we expect? How much does each one mean? Well, let’s do some math::
There are eight players in your lineup each week and there are 17 weeks. This means your roster will have 136 “Usable Weeks” when all is said and done.
There are 20 players on your roster and each player has a maximum of 16 weeks they can contribute to your score, which gives us 320 potential scores.
In theory, the facts discussed in the last two bullet points would tell us we should *expect* each of the 20 players on our roster to give us 6.8 “Usable Weeks” over the course of the season. (136 weeks needed to fill our season, divided equally across the 20 players – 136/20 = 6.8)
Additionally, we know from our breakdown of Positional Silos that we need roughly 350 points from each of our 8 silos if all things are viewed equally.
However, we should also realize that things are certainly not going to unfold in an equally distributed way across our roster and season. We are not going to get the same amount of Usable Weeks contributions from each player on our roster. We are also not going to have all of our Positional Silos contribute exactly the same amount of points.
This is an important concept to keep in mind when allocating draft capital, and we will look for strategies that allow us to find “cheat codes” or short cuts to maximizing our Usable Weeks at certain positions to super charge the rest of our roster.
Points Added
Similarly to our “Usable Weeks” concept, the idea of “Points Added” is very straightforward. We can easily see how many points a player has scored in a given week, but how many points did they actually ADD to that specific roster? It is a very elementary concept – if a player scored 16 points for you that week and counted on your roster, how many less points would your team have scored if they were removed? Example: Kyle Pitts scores 18 points at your TE position in Week 6, and your next best TE score was 10.5 – this means he “added” 7.5 points to your roster that week. Of course, the ideal way for your roster to play out would be in spike weeks that complement each other perfectly: TE1 scores 20 points in Week 1 and 2 points in Week 2, while TE2 scores 4 points in Week 1 and 18 points in Week 2. Through two weeks, both tight ends have scored 22 points but your roster has accumulated 38 points in that “Silo”.
All of these examples are just to help see/understand the concepts. When building our rosters and constructing things we need to think within the context of that roster how often will a player give us a “Usable Week” and how many actual “Points Added” can we expect from them.
Drafters :: Usable Weeks (Part 2)
WRITTEN BY: MIKE JOHNSON (@MJOHNSON_86)
Now that we have discussed and established what the Usable Weeks and Points Added concepts are, we can dig deeper into what they mean and how they affect how we play on Drafters. We know that we need to target roughly 2,800 points and we know that the math on that says we need to accumulate roughly 350 points on average per starting position. From there, our thought process needs to be focused on how those points are scored and building a roster that plays on these ideas to optimize our rosters. Said another way, Drafters cumulative scoring Best Ball contests are NOT about having the 20 players who score the most points. Rather, it is building rosters that maximize your draft capital to create the most efficient scoring roster possible from the 20 players you select.
Any golfer or golf fan is likely familiar with what “Best Ball” is in golf. The simplified explanation is two (or more) players are on a team and each plays their own ball on every hole, but the team’s score is just the one BEST score from each hole. For instance, if me and my friend Collin were on a team and I made a birdie (-1) on the first hole while Collin made a double bogey (+2), our team’s score would be -1 at that point. Then, on the second hole, Collin makes a birdie (-1) and I make a triple bogey (+3). At this point, my individual score is +2 and Collin’s is +1….but our TEAM score is -2. This would be us optimizing our scoring. Whereas another team may have both made pars on both holes and each individual is even par (+0) and beating both me and Collin – but their team is even par and two strokes behind our team. The flip side of this would be if Collin and I both birdied the same hole and then made our double bogey and triple bogey also on the same hole. This is a bit of an extreme example, but for our purposes of Best Ball it exemplifies the importance and need to optimize our rosters.
There is value in “solid” players who consistently give us “usable weeks” and keep us afloat. There is also a lot of value in players who can “spike” and give us a lot of “Points Added” in a given week. There must be a balance, however, and the way we build teams needs to be thoughtful and reflective of three things::
How each of our players scores their points – consistency, variance, floor, and ceiling all being considered
What parts of the season our players are likely to score the most points (and the least)
How likely the players strong games are to add points to our team based on the rest of the roster
Usable Weeks
We know we need roughly 2,800 points to have a high placing roster in a Drafters contest, which is about 350 points per position. However, not all positions are created equal. For our purposes we should look at this as needing varied numbers from each position. These are obviously not exact and are mainly for the purposes of thinking through rosters as you build, but here are the rough “target” numbers I think about for each of the eight starting roster positions::
QB: 400
RB1: 425
RB2: 300
WR1: 475
WR2: 350
WR3: 300
TE: 275
FLEX: 300
Broken down into weekly averages, these would be our targets for each position::
QB: 23.5
RB1: 25.0
RB2: 17.6
WR1: 27.9
WR2: 20.6
WR3: 17.6
TE: 16.2
FLEX: 17.6
These numbers may seem arbitrary and made up, but let me share with you the results from my team that took 7th in the Drafters Main Event in 2023::
QB: 411.8 (24.2)
RB1: 399.6 (23.5)
RB2: 235.7 (13.9)
WR1: 493 (29.0)
WR2: 386.2 (22.7)
WR3: 283.2 (16.7)
TE: 280.3 (16.5)
FLEX: 256.9 (15.1)
While it is not an exact science, you can see that all of my team’s production came in a very similar output to the way I think about team structure and what I am trying to achieve. Depending on how an individual season plays out and a team is constructed, there are a lot of different ways to get to the same end goal of 2,800 points – but most likely the point distribution will look roughly like this.
Now, when you are building a team depending on how you allocate draft capital these point averages may shift across the positions. For example, my team highlighted above was a WR-heavy team in a year where “Zero RB” worked out very well due to first round RB injuries and a lot of “hits” at RB in the mid-rounds. That, along with me having the “nuts” at WR by getting Ceedee Lamb and Amon-Ra St. Brown at the 1-2 turn gave a very clear path to my results, as you can see with my RB output being lower than my “target” numbers. While I haven’t run the numbers on all the top teams from 2025, the way the season played out with Gibbs, Bijan, CMC, JT, and Achane all scoring a load of points (all five averaged over 20 points per game on their own) would likely have the scoring output swayed heavier towards the RB position. Regardless, the main point here is you are going to have a few spots that carry the load on each roster and by identifying where those spots should be you can optimize your later picks to add value to your roster.
The way this plays out in terms of “Usable Weeks” is first by identifying the fact that these averages are reached not by equal output, but by highs and lows. Some interesting data points from my 2023 roster::
My TE position’s 16.5 point average consisted of five weeks of 20+ points and five weeks of single digit points.
There were 28 instances over 17 weeks of a player scoring double digit points and not counting cracking my lineup to count towards my score: 11 RB, 15 WR, 2 TE.
There were 9 instances over 17 weeks of a player scoring single digit points and counting towards my score: 3 RB, 1 WR, 5 TE.
Four players on my roster only had their score count one week out of 17.
The point here is that your lower scoring positions have a lower threshold for what it takes for a player to give you a Usable Week and your higher scoring positions have a higher threshold for players to give you something of use. If you are weaker at a position, the steady guys with more predictable roles have more value. If you are stronger at a position, your later picks at that position need to have higher theoretical ceilings to have a chance to contribute. If you have a contending roster, you have likely hit on most of your early picks anyways so you are going to end up with at least a couple of roster spots who basically give you nothing.
Points Added
Circling back to the golf example from early in this article, we can look at some specific players to discuss how these concepts can be put into practice::
Jordyn Tyson, WR, NO – Tyson continues to drop in ADP as his hamstring injury appears to have him set to miss the first several weeks of the season. On the surface, many people may see this “value” as being the perfect target for teams that are weaker at WR through 10 rounds as he could bring it all together in the second half of the season. In reality, his profile on Drafters is much better suited for teams that are already very STRONG at WR. This is counterintuitive for most, but let me explain. We know he is likely to miss several weeks and with the Saints Week 8 bye, it is possible that the first time we see him is Week 9. A team that is weaker at WR is hurt much more by all those zeros he takes early in the season. If this was DraftKings or Underdog, Tyson is a perfect addition to those weaker WR rooms because they don’t have to score 2,800 points over 17 weeks….they just need to beat 10 other teams during the first 14 weeks and then get the right spike weeks and some pod luck late. Should Tyson’s talent shine and he goes off during the second half of the season, he could put up the type of numbers that could move the needle on Drafters teams that are already loaded at the position. Compare him to someone like Khalil Shakir going in the same range right now. Shakir never scored 21 PPR points in a game last season, but he had nine weeks of double digit points. In a weaker WR room, his score is counting at least a few times. In a stronger WR room, he’s probably not adding much to the roster. In summary, when we are building our rosters for Drafters we should be doing the opposite during the second half of drafts from how we build on DK and UD. If you are especially strong at a position, take the biggest swings at that position later in the draft because in order for that roster to be in contention you will need those early picks to have hit – which means your threshold for Usable Weeks and Points Added will be higher. Likewise, if you build in a certain way and have a specific position that is weaker you should give extra value to more secure roles who can just give you “solid” weeks somewhat consistently.
Zach Charbonnet, RB, SEA – Charbonnet is on the defending Super Bowl champions and is a trusted and beloved player in the organization, but is also coming off a torn ACL that will keep him out the first few weeks. Whenever he does return, he will join a backfield with first round pick Jadarian Price and whichever RBs the Seahawks give work to while Charbonnet is out. Last season he scored over 20 points only once and this year coming back from an injury can we expect that number to grow? On DK or UD, he’s a great later round RB pick to add to weaker RB rooms. On Drafters, the missed time hurts those rosters a lot more. As a side note to this, Jadarian Price is a far better pick on Drafters than he is on DK or UD for exactly these reasons. His chances of being really good early in the season carry more weight on Drafters and the chances of losing work to Charbonnet down the stretch don’t hurt him as much. His industry consensus ADP’s are in large part built around the idea that he may actually lose value during the “money weeks” on these other sites.
Ray Davis, RB, BUF – Similar to Tyson, his best fit is actually on teams that are very strong at his position early in the draft. Why? Because these teams are do not really need him to give them Usable Weeks early in the season and are likely to be weaker at WR, which means they will use RB in the Flex more often throughout the course of the season. Again, similar to Tyson he is a perfect fit for a “Zero-RB” or “Hero-RB” build on DK or UD because those teams can just be “pretty good” most of the season and then if he gets his chance later in the year that could put them over the top….but on Drafters the distribution of his production output is likely to hurt their chances of reaching the top of the leaderboard. Put him as your RB4 on a team with something like JT, Barkley, and Breece taken in the first four rounds and all of a sudden if James Cook gets hurt in Week 9 you have essentially added another elite player at the position who can actually move the needle and add points to your roster. On a weaker RB team if that injury happens that deep into the season, the roster is likely already too far behind to catch up.
The main thing to wrap your mind around with these concepts is that this is a CUMULATIVE SCORING contest. You are not trying to raise your floor or create a bunch of “pretty good” teams, then using game stacks for the later weeks to try to swing variance in your favor during the playoffs. You are trying to optimize for a 99.9 percentile outcome over the course of 17 weeks. This means thinking through things somewhat unconventionally and being willing to accept risks that wouldn’t make sense in other contests. If you win your 14-week pod by 300 points on DK or UD, you still start over at 0 in Week 15. On Drafters you need to optimize for upside while not digging yourself holes you can’t come back from. On DK and UD my main goal is advancing as many teams as possible and being very “solid and sound” in my constructions, then letting the chips fall where they may in the playoffs. On Drafters, I am actively trying to lower my rate of cashing teams with my approaches and roster constructions because I am doing it in a way that increases my chances of creating a true super team that can challenge for 2,800 points.
Drafters :: QB Quotient
WRITTEN BY: MIKE JOHNSON (@MJOHNSON_86)
The optimal approach to the quarterback position is one of the largest differences between Drafters cumulative contests and the playoff style formats most other sites use. Here are some big picture thoughts for the QB position on Drafters::
“Winning weeks” isn’t the priority at the position, IT’S ABOUT THE SILO
All top-10 teams the last few years have scored 350+ points from their QB Silo
The average point total from the QB position of top-10 teams is consistently around 390-400 points
Your total score from your QB Silo if you rostered both of the top-2 QB’s the last three years was 432.5 (2023), 496.1 (2024), and 462.7 (2025).
The number of QBs to score at least 200 points through Week 17 the last three years has been 20 (2023), 19 (2024), and 21 (2025). Basically like clockwork, 20 QBs per season will drop 200+ points.
The number of QBs to score 290+ points each of the last five years has been 10, 9, 7, 10, and 10.
These numbers lay the groundwork for a critical number I call the QB Quotient. The takeaways from the above numbers are that there are a lot of players who will contribute to rosters and the margin for gaining on the field is relatively slim. Every high placing team gets 350+ points from their QB silo, but we basically never see any score over 420 points. There are a lot of ways to get there, but in order for it to matter we need to do so without overspending at the position. The QB Quotient is how we think about and track the allocated draft capital to give ourselves the best chance to finish highly. Calculating your QB Quotient is simple, you just add the rounds you drafted your first two QBs and divide by two. So if you took a QB in the 6th then another in the 10th, your total is 16 and then you divide by two which gives you a QB Quotient of 8. The interesting thing about this is that over the last 4 years, roughly 90% of top-10 rosters have a QB Quotient between 8.5 and 11.5.
What this is telling us is pretty straightforward – don’t overspend at a onesie position where the advantage of “dominating” the position is relatively low. The biggest difference this has on Drafters as opposed to other sites is that on other sites there is a real tangible advantage to having the right QBs on the right weeks. If Joe Burrow scores 40 points in Week 15 and you have him stacked with Tee Higgins who scores 30 and you also have Dak Prescott stacked with Ceedee Lamb and they combine for 70 points themselves in Week 16, you’re in an awesome position to advance to the Week 17 Finals. But on Drafters, you likely spent a 6th and 8th round pick on those QBs to give you a QB Quotient of 7. Even in their best case scenario seasons, Burrow + Dak would only give you about a 40-point advantage on other contending teams while robbing you of two top-100 “Flex” options. It becomes very thin very quickly to try to contend with the top teams in a contest with over 100,000 entries. The biggest mistake I see people making on Drafters is falling into this exact trap by drafting their first QB somewhere in the 4th to 7th round but then having the QB of a WR they took early in the draft “falling” to them in the 8th to 10th round. This value seems too good to pass up, but by doing so they are suboptimizing their roster. Think of it this way, if the Lamb and Dak combo truly hits then every roster in the contest who has Dak is going to get a great QB score and those who didn’t also spend a pick on Burrow basically get an extra top-70 positional player that you have to try to catch up against. A healthy amount of those rosters will hit on a player who puts up a lot of points. It gets very thin, very quick.
Again, we want a QB Quotient between 8.5 and 11.5. A QB Quotient below 8.5 robs you of too much draft capital in relation to the massive field you are competing against when you consider the relatively low amount of points you can actually gain. Meanwhile, waiting too long at QB limits your shots at spike weeks (a lot of QBs who score in the low to mid 200’s for season long points do so on consistency, but don’t go over 20 points often). You’re going to need 350+ points from the position in total to contend, which is an average of 20 points per week, so having three or four QBs who each only go over 20 a couple of times makes that a really tall task. Take Josh Allen in the 3rd or 4th round? Sure….but then just wait until the 13th round or later and take someone like Sam Darnold, Aaron Rodgers, etc. who you can be confident will be starting and give you a decent outing on Allen’s bye week (barring injury) and maybe gives you 2 or 3 other good weeks where they might add a few points over Allen. If Allen (your top-40 pick) misses any more than a couple of weeks you’re not winning this contest anyways, so use his selection to basically say he’s scoring around 350 this season by himself so just focus on the other three positions for almost the entire rest of the draft.
One other note on this, stacking is obviously popular for other contests and also has a lot of value on Drafters. However, you never want to reach to force stacks. Many high placing rosters stack, but the QB isn’t a “must” as a part of it. You can still fill your QB silo in other ways (especially if it allows you to save draft capital for other positions).
(Editor’s Note:: When figuring out my QB Quotient, if I am picking within one spot of the “turns” I use halves to denote my investment. By this I mean if I pick in draft spot 1, 2, 11, or 12 I don’t use the exact round a player was selected. For instance, if I took Lamar Jackson at pick 62 I consider his number 5.5, rather than 6. My reasoning for this is if you are at the actual turn you obviously just have back-to-back picks and if you are one away from the turn you can often tell which positions the person at the turn will pick.)
Drafters :: Sacrificing A Silo
WRITTEN BY: MIKE JOHNSON (@MJOHNSON_86)
The concepts of Usable Weeks and Points Added give us the framework from which we can approach our roster building process. We outlined the total points we need to find from our roster and roughly the expectations for getting there when broken down by “Silo”. One thing I like to do to take advantage of these concepts and really lean into them is taking things to the extremes by doing something I call “Sacrificing A Silo”. The idea here is pretty straightforward. On most rosters, people try to balance their rosters to some extent and at certain points of the draft it feels like, “OK, I need to take a player from position X now.” What if we don’t, though? The natural way people think about their roster is to first fill out all the starting positions, or do so relatively quickly within the timeframe where it is possible. Think about it, how often do you or another drafter you see go past 10 rounds without having all 8 starting positions “filled” on your roster. I do it myself often, and that is certainly not a terrible strategy. However, the concepts of Usable Weeks and Points Added show us a path to where we can get the most bang for our buck in terms of what we get from our draft capital.
The idea of “Sacrificing A Silo” is that you pick one of your silos and intentionally let it go FAR past the point of comfort to address it. While drafting, I am generally thinking through my picks and roster construction with the idea of considering how my roster will be filled out, what I will need from each pick, and how the picks can/will work together. When we get to the later parts of the draft, we are usually taking what are more or less dart throws and filling out our roster to give us what feels like a “comfortable” construction. However, the reality of this is that many of these players are contributing very little to our rosters, if at all, and that is especially true if our roster is doing very well in the tournament. The reason for this is quite simply that in a cumulative scoring contest we are competing against EVERY other roster for the course of the season. We need ultimate outlier outcomes to finish near the top of that leaderboard and that means that a contending roster will have “hit” on basically all of their early round picks. The next level of that means that if all of those early players are hitting and having strong seasons, the threshold for “hitting” from our later round picks increases significantly. If you had Trey McBride in 2025, he failed to score 9 points only once over the 17 week season and scored under 12 points only three times. This means that your late round tight ends were barely adding anything to your roster other than on McBride’s bye week.
Wide receivers are the most variant position, and we can start more of them than any other positions, so that is the one spot I really never try this with. However, this strategy is highly viable and makes a ton of sense at QB, RB2, and TE. Let’s walk through each of those options::
Quarterback – We know that the teams that contend to win these contests are getting 350+ points from their QB Silo. There are a ton of great options earlier in the draft and we can say with a pretty high degree of certainty that 3 to 5 of those QBs will score 340+ points on their own, with around 10 scoring 300+ on their own. This seems like a lot to pass up on, but again we need to think about finding a path to first place. The opportunity cost of those higher ceiling QBs is going to be losing a shot at a player at RB, WR, or TE who could feasibly “hit” for a game changing outcome. Meanwhile, we know the “ceiling” for the amount of points scored from this Silo is not so high that it can’t be overcome. When we look later at the board at QB, we can see a lot of opportunities for those later QBs to contribute in a big way. Here are some meaningful QB results from the last couple of seasons::
2025::
Sam Darnold – 14th-16th round pick, scored 240 points
Daniel Jones – 14th-16th round pick, scored 230 points in 13 games
Matthew Stafford – 14th-16th round pick, scored 331 points (draft position was lower due to injury concerns)
Aaron Rodgers – 16th-18th round pick, scored 218 points in 15 games
Bryce Young – 15th round pick, scored 211 points in 15 games
Jaxson Dart – 17th to 20th round pick, scored 225 points in 10 games
Sam Darnold – 16th-18th round pick, scored 312 points
Drake Maye – 17th-20th round pick, scored 187 points in 11 games
Bo Nix – 15th-17th round pick, scored 294 points
Geno Smith – 15th-17th round pick, scored 254 points
There are similar examples in 2023 and before as well. The bottom line here is that USABLE production is very available at QB later in drafts. Obviously some of the bigger “hits” like Stafford (2025), Darnold (2024), Nix (2024), and Maye/Dart on a points-per-game basis in their rookie years are outliers and harder to depend on, but the bottom line is we can take a bunch of swings late at the position and have a strong chance of combining a couple of lower ceiling but consistent producers with some overachievers who don’t end up at the top of the position but have a few spiked weeks. Taking four QBs in rounds 13 through 20 gives you a shot at executing this strategy and “filling” your QB Silo in a cost effective way.
Tight End – At the tight end position, the expected and necessary scoring threshold from our TE Silo is about the lowest of the eight positions on our roster. Obviously more tight end usage and personnel in the league is a trend right now, but overall scoring across a season is much harder to predict. In past seasons there have been years where teams have scored as little as 190 points from their TE Silo and finished top-10 in a contest. Most of the time we need 250+, with 300-ish being the higher end expectation. Think QB Silo and subtract 100. Obviously the big difference between QB and TE is that you can use a second TE score on any given week. All of that said, we can load up on later tight end options whose decent scoring weeks suddenly become Usable Weeks and they are adding actual points to our roster on teams where we do not. Here are some examples of later picks at the tight end position that hit in big ways the last two seasons::
Cade Otton – 16th-18th round pick, scored 140 points (3 games of 18+)
Mike Gesicki – 19th-20th round pick, scored 130 points (3 games of 16+)
All of these players, on their own, scored 203 points or fewer. And all of them had a lot of “dud” weeks where they scored single digit points. However, as we look for a cheap way to fill a Silo, tight end is fairly “easy” relative to other positions to find a way. Because of the dud weeks, that means that for these players to put up these point totals they have had several double digit weeks and usually a couple of weeks scoring 18+. To get 272 points from your TE Silo, you need 16 points per week. This is probably my favorite Silo to “sacrifice” as there are the most paths to filling it and the lowest threshold to cross. I LOVE taking four tight ends later in the draft and hoping they can “ham and egg” a season together for me with their Usable Weeks complementing each other just right. Here are some tight ends with ADP’s in the 13th round or later who could easily end up top-10 at the position, or at the very least have a stretch of really strong games at some point during the season::
Terrance Ferguson – The whole industry is on this guy, but it is for good reason. Talented player, versatile skillset, elite offense.
Chig Okonkwo – Elite after catch ability and great athlete, Jayden Daniels peppered Zach Ertz with targets.
Dalton Schultz – Texans wide receiver room is beat up. Schultz had 8 games of less than 8 points last season, but 6 games of 12+ points (3 of which were 18+).
Hunter Henry – Similar to Schultz, lot of dud weeks but will have usage spikes.
Kenyon Sadiq – Elite talent, who knows when they unleash him but has potential to be a top-5 guy under the right circumstances.
AJ Barner, Pat Freiermuth, Cade Otton, Greg Dulcich – Could be more primary targets for their quarterbacks than most realize.
Colby Parkinson – Rams TE1 who goes in the 18th-20th round.
Michael Mayer – One Bowers injury away from every week top-10 TE option.
There are others that fit the bill as well and have paths/potential to giving us a stretch of very usable games, but the point is simple. There will almost certainly be a combination of two or three of these guys that combine for a 250-300 point TE Silo this season. So on a lot of my rosters I am simply taking four shots in the super late rounds and hoping for the best.
Running Back (2) – The idea here is that we get an early RB (in the first four or five rounds) and they have a massive, top-5 RB season where they score close to 350 points on their own, essentially “filling” the RB1 Silo by themselves. From there, we are looking at our RB2 Silo on its own and thinking about how we can fill it in a cost effective way. Again, comfort comes from building soundly and with a structure we are familiar with and can look at when we are done and think it looks/feels good. The tendency, of course, is to get that “RB2” within a couple rounds at worst of the RB1 and if the RB2 is taken a little later, say in rounds 8-10, then take another one or two very quickly after that. That is a totally viable strategy, but as we try to find ways to maximize our Usable Weeks and Points Added from our later picks and try to find outlier outcomes for our roster in this style of contest we need to push the limits somewhere. We can get that “Stud” early and then use our last 6 or 7 picks at RB to take shots at filling the RB2 spot. Obviously it is a thin needle to thread, but if you hit it correctly you are absolutely golden. There is also a level of balancing who the RBs you take are when executing this strategy, as some of them need to have actual roles early in the season so you aren’t just getting 3 points a week for the first month. Guys like Justice Hill, Kimani Vidal, George Holani, Malik Davis, and Samaje Perine are prime targets who maybe don’t have massive ceilings over the course of the season but should get at least a handful of touches right out of the gate. It is going to feel uneasy having guys like Tyjae Spears and Dylan Sampson as your RB2 and RB3, but the payoff could be massive.
Summary::
It is hard to find a path to the top in this type of contest, but Sacrificing A Silo gives us a direct path to having our late round picks that “hit” actually help us while simultaneously juicing up the strength of our other positions. It is a highly volatile strategy, but we need to embrace that somewhere to find the kind of outlier season that is required for a big payday. This strategy gives you a direct answer to the question of “what needs to go my way?” to be in contention. Obviously any roster will need their early picks to hit in a big way and have good injury luck to be in the mix, but this gives us a way to maximize what we get right. Matthew Stafford’s massive 2025 season didn’t add much to a roster with Josh Allen or Drake Maye on it when you compare it with a roster that had only later round QBs along with him. Kyle Pitts or Harold Fannin’s value add was much lower on Trey McBride rosters. If Tyjae Spears gives us eight double digit scoring weeks and goes over 20 four or five times, it doesn’t help us much if we spent three of our first six picks at RB and they all had top-10 seasons. This lets us maximize the Usable Weeks and Points Added for our later picks while juicing up the strength of our roster in other places. A double whammy that if executed correctly can act like a cheat code to the top.
Drafters :: SURVIVAL Edition
WRITTEN BY: MIKE JOHNSON (@MJOHNSON_86)
This year, for the first time, Drafters is having a “Survival” contest. The structure is unique and presents a much different challenge and approach than any other type of Best Ball contest currently available. It is a contest that has one leaderboard for all teams drafted in it, just like the other Drafters cumulative scoring contests, but the leaderboard resets each week. This structure combines the concepts of a couple of different types of games.
First, Underdog has the “Eliminator” contest, but that is a structure where the top 6 of 12 teams from your initial draft advance and then you have head-to-head matchups every week until a Week 17 three person final. The Eliminator structure promotes building a solid team with a high floor and being sound enough to win on a weekly basis with only one opponent per week, but there is a ton out of your control. This creates a very volatile and high variance situation where who you get matched up with each week has just as great of an impact on your outlook as how your team performs. It is fun, without a doubt, but the level of variance is simply so high that it becomes extremely difficult to predict or strategize for. Everyone complains about “pod luck” during the playoff weeks of regular season contests on Draftkings and Underdog – well the Eliminator is basically 15 weeks of needing some “pod luck”.
Second, the Drafters full season cumulative scoring contests are designed in a way that you are looking for extreme outlier outcomes and require us to think deeply of how to systematically turn the math in our favor and give ourselves the highest chances of things coming together just right to reach 2,800 points over 17 weeks. That requires building in certain ways and having a certain amount of risk and a mindset to carry us to the top of a very tall mountain.
The Drafters SURVIVAL contest combines those two ideas. The weekly nature of advancement makes it so that we do not need to hit everything perfectly on our roster and push the limits in pursuit of 2,800 points. However, the nature of the contest with one leaderboard for all contestants smoothes out the variance and takes away the weekly “luck” aspect. As much as people complain about “pod luck”, it is also something that often works in our favor. The luck is removed here, and each week during Weeks 1 through 14 the top 75% of contestants advance, then the top 50% advance in Week 15 and again in Week 16, then there is a 125 person final in Week 17. That is a lot to digest. Here are the things we must consider strategically within this contest::
1 – Advancement Rate
As with anything, the best way to analyze this is to break things down into smaller pieces. First of all, in playoff format contests advancement rate is the most important thing. You have to be alive for anything else to matter. This has been studied and discussed across the industry for the last couple of years and the bottom line is advancing boosts your EV more than anything else because it gives you a seat at the table. This is also true for Drafters SURVIVAL, but in a slightly different way. Obviously we need to find the best way to advance on a weekly basis, which means we can never finish in the bottom 25% in any week. This is incredibly relevant, because that threshold is a lot tougher than people realize. I finished 7th in the Drafters Main Event in 2023 with a roster that had 2,747 points over the 17 weeks. However, that roster scored only 112 points in Week 1 and would almost certainly have been eliminated right away in the SURVIVAL format.
2 – Finals Payouts
We can’t overthink things in terms of stacking for Week 17. Yes, that is where “all the money is”, but it is only 125 teams which is the DFS equivalent of a very small field tournament. Team stacks are fine, because they can help carry you throughout the season if you are right about an undervalued offense, but worrying about the game stacks is too deep in the weeds and focusing on the wrong things, in my opinion. Especially when considering the small field size in the Finals, it simply isn’t a necessary thing to be altering your draft strategy. If you happen to get players who correlate in Week 16 or 17 simply by chance that is great, but the primary focus should be our Drafters strategies adjusted for this format.
3 – Fighting The Urge For “Floor”
The initial tendency and thought process for many when they see this type of contest is to think that it is about “safe” players with high weekly floors and predictable usage. However, this won’t last you for 17 weeks. There are 8 positions on your roster and at some point your focus on “floor” is going to hurt you in a major way where you just end up with a bunch of players scoring 8 to 12 points and scoring 110 to 120 points total and ending your season. The idea of “Usable Weeks” can quickly be erased by focusing on certainty and stability in this type of contest because it opens you up to situations where you aren’t adding many points above replacement at any position. Your 20 players might combine for 220 points but your team itself scores only 120. This approach also opens you up to being on the wrong side of variance when a high scoring NFL week hits. Your “solid” roster might put up 135 points in Week 12, but at that point in the season the field has been whittled down quite a bit to stronger rosters and if fantasy scoring goes wild that week then the “top 75%” threshold is probably going to be pretty high.
SURVIVAL Strategies
So the idea here is that advancement is the most important thing, but we want to focus on it without becoming obsessed with stability. We still need outlier outcomes, just not the same type of outlier that the full season contest entails. Our roster must not have any low floor type of weeks, but individual players can. And stacking up teams can be a great strategy, but we can’t let ourselves get consumed with Week 17 matchups and correlations. Got it? Ok, good. Now here are some ways we can do that::
SURVIVAL STRATEGIES
1. Sacrificing TWO Silos
There is a whole strategy article about “Sacrificing A Silo” for the regular Drafters contests where I go deep in the weeds about how and why it is a solid strategy. The basic idea is to take a high quantity of dart throws at one specific Silo, hope it works out, and be ahead of the game with a much stronger roster at your other seven Silos. However, in that specific format it is almost impossible to take that approach on multiple positions because it significantly limits your high end outcome over the course of 17 weeks. The SURVIVAL format, however, makes this a more viable option. Take, for instance, the RB2 and TE positions. We want 300+ and 250+ points from those Silos in regular Drafters contests to give us a reasonable shot at 2,800. But for this contest, what if we merely got 225 and 175 points from each of those Silos? That is an average of only 13 points per week from the RB2 Silo and 10.3 points per week from the TE Silo. Seems reasonable enough. That means your other 6 positions (QB, RB1, and the 3 WR’s and FLEX) need to be getting you about 120 points every week, or 20 points per week from each position. Sound familiar? (That is the exact target we have for all 8 positions in the mathematical breakdown for regular Drafters contests). The idea here is simple, pick a couple of spots where you take your lumps and hope you can get double digits out of them each week, with the side effect being you have an extremely strong roster everywhere else that should have weekly ceilings that can keep you afloat in the top 75% of rosters.
2. Supercharging A Silo (or “Position Maxxing”)
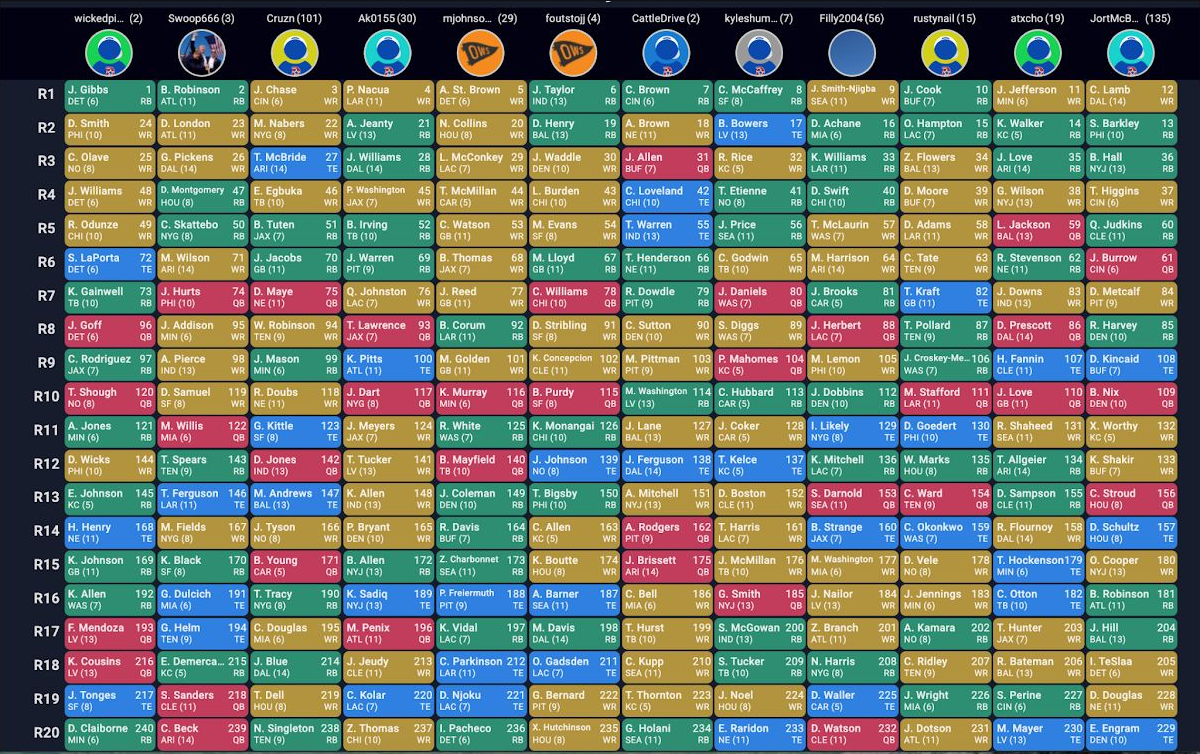
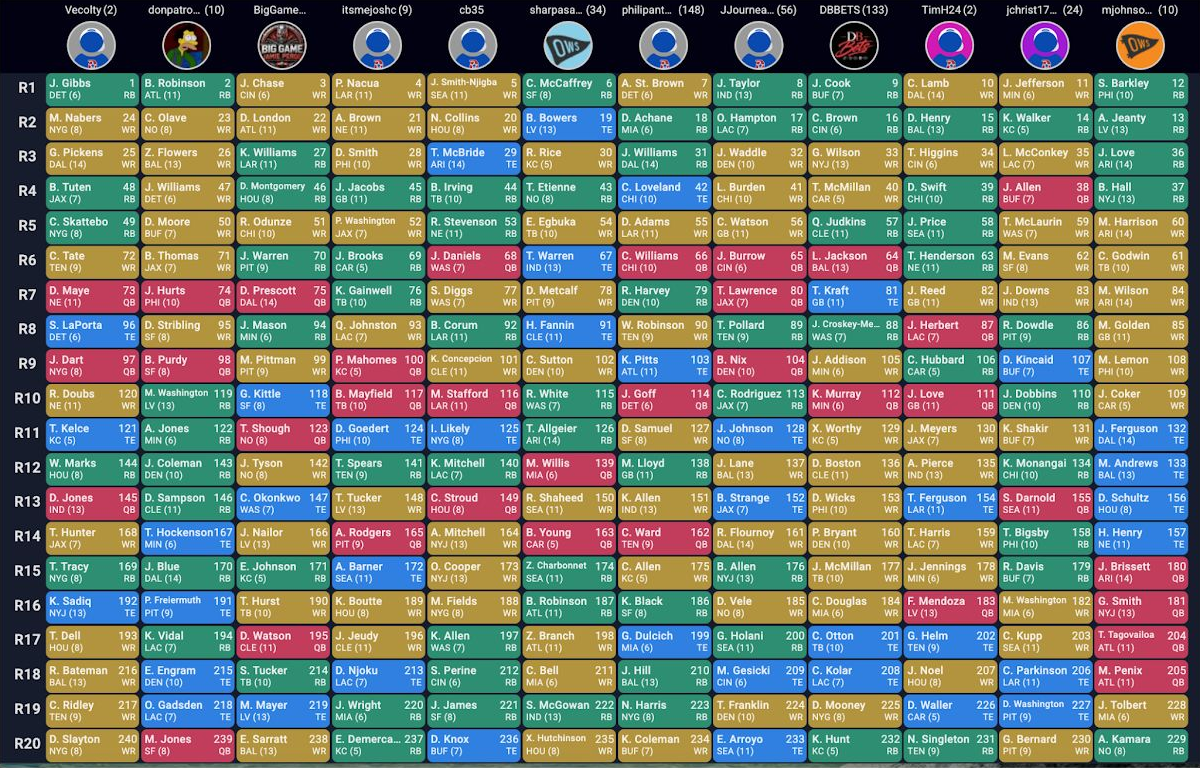
Similar conceptually to “Sacrificing A Silo” or “Sacrificing Two Silos”, but taken from a different lens. The idea here is to go full throttle at either RB or WR, to an excessive amount, and supercharge your output from those Silos. While this would be a very poor and wasteful approach in a regular Drafters contest that would essentially guarantee you can’t have a high finish, the idea in SURVIVAL is that stacking up so many elite players at either position would give you a high cumulative floor from the position – and the rest of your roster would be able to contribute enough points to keep you moving along. Here are two draft boards where I took this approach, one at RB and one at WR::
You can see in the first example from the 12-slot I took an RB with each of my first four picks. Those are all extremely talented RBs who could score 25 to 30 points in any given week and all have clear paths to top-10 seasons at their position if they stay healthy. The idea here is I get 60-70 points per week from those players at RB, RB, and FLEX combined. Then I need another 60-70 from my other five positions. You can see on that roster I also “sacrificed” the QB Silo with four late picks.
In the second example, from the 5-slot, I started with seven straight WRs. Again, this level of ignoring RB for the first 90 picks of the draft would be untenable in regular Drafters formats in 2026 – especially without getting a high end option at QB or TE. However, in the SURVIVAL format our goals change. Seven WRs with high weekly ceilings gives me a very high cumulative floor for the positions/silos they occupy. Idea here would be most weeks can we get 70-80 points from those four spots – then scrape by with enough from the other four spots.
3. Bye Week Strategies
The bye weeks are always a contentious spot in Best Ball. There are a few ways you can go with how you approach them. Here are the various ways I think about them and for each draft I may approach them differently::
Balanced:: You can try to spread them out so your roster is always slightly below full capacity from Week 5 to 14, but rarely if ever at full strength. This reduces your chances of tanking in a given week, but leaves you slightly susceptible to depth issues in any given week as you are basically always down a man or two.
Bottlenecks:: Rather than balancing things out, you can go hard at certain bye weeks. The idea here is that you are selectively increasing your variance on one or two specific weeks. If you select eight WRs and four of them have Week 11 byes, you are putting a ton of pressure on your other WRs during Week 11 to have at least decent production to advance. If you survive the bottleneck, you have an advantage on the field with a deeper roster in all the other weeks.
Backloading:: You can try to backload the byes and prioritize selecting players with double digit bye weeks. This can help you advance through the early portion of the season with a full roster for the first 9 weeks while others miss key players, making staying above the Mendoza Line of top 75% very attainable. However, it also makes your roster most vulnerable later in the season when, in theory, the remaining teams will be the strongest. The other potential benefit to this concept is it gives your late round selections that may have high “contingent” value time for their roles to ascend.
Frontloading:: Just the opposite of backloading. Take primarily players who have byes in Weeks 5 through 8. Your team will be at full strength during the later weeks against tougher competition and you can make your late round picks, who you will have to rely on during those earlier weeks, players whose roles are more stable and predictable during the early portion of the season. It opens you up to an earlier exit and missing the money, but could strengthen your chances in later weeks when the field gets stronger.
4. Injury Discounts // Complementary Players
Because you can be knocked out in Week 1, most people are dinging the players whose statuses and/or roles are in question early in the season. However, early in the season there are less injuries across the league and other players are easier to project. Take, for instance, Alvin Kamara and Isiah Pacheco. They are their team’s RB2 and probably have some standalone value within their offenses once on the field, but both are consistently going in the 200’s in this format because they could be zero’s the first 2 to 4 weeks. But what if you put them on a roster with a couple of stud RBs that have double digit bye weeks? You don’t want/need Kamara or Pacheco to contribute on that roster the first few weeks anyways, but they could be scoring meaningful points in November when you need them. This is just one example, but something we should consider when building our rosters for SURVIVAL. Which players is the field docking in this format for things that don’t actually effect how valuable they are or could be?
5. Rankings Adjustments
Best Ball rankings and ADPs are based on the overall idea of “standard” contests and the risks and expectations over the course of a season. SURVIVAL contests start in Week 1 with elimination, however, so the player evaluations need to change. Christian McCaffrey is a top-3 “in a vacuum” option as long as he is healthy. He is starting the year healthy. Jadarian Price is a 5th or 6th round pick because of worries that he splits work heavily with Zach Charbonnet in the second half of the season. But to start the year, he is clearly their top RB option. Kirk Cousins is probably going to be the Raiders starting QB for the start of the season and who knows when that ends. He goes in the last couple of rounds, if at all, in SURVIVAL drafts. Just a couple of examples of things we should be considering when drafting in this format.