Swing Trading To NBA Top Shot
What is Swing Trading?
“Whether we’re talking about socks or stocks (or stonks?), I like buying quality merchandise when it is marked down.”
For my math people in the crowd, I like to describe price movements in markets as a vector, with both direction and magnitude. The direction comes from charting and trending, the noting of patterns and trends, and historically backed projections inferred from those observations. The magnitude comes from the Fibonacci ratio, or “The Golden Ratio.” Fibonacci attempted to make sense of the vast expanses of existence through one simple value. This theorem has proven accurate in many walks of science and life, from universal expansion to impulses in markets. We’ll discuss this value further after quickly returning to the fundamentals of charting.
Elliot Wave Principle/Theory
Since the late 1970s, scholars have been attempting to classify and predict movements in publicly traded markets, which is referred to as technical analysis. These ideas originated in the New York Stock Exchange and have since carried over into other markets. In 1978, AJ Frost and Robert Prechter released a study on crowd psychology entitled “Elliott Wave Principle: Key to Market Behavior.” This was the first publication I read in my journey and I highly recommend it to anyone looking to get a good grasp on the fundamentals of epistemology, crowd psychology in a publicly traded asset, human behavior, and, most importantly, charting and trending. I have a free copy of it in PDF form and have already sent it out to many-an-OWS-user. If you’d like a free copy, hit me up on Twitter or Discord with your email and I’d be happy to send you one. If you want a copy of your own, they are available for purchase online. It is 118 pages of goodness, so the file is too big to send over text, twitter or Discord. If you are looking to take this seriously, I highly recommend reading it cover-to-cover multiple times.
Fibonacci
As for Fibonacci Ratio, the magic number is 0.618, or 61.8%. This value is important to us for numerous reasons, the foremost being its close relationship to the magnitude of impulse waves in a publicly traded (and manipulated) asset. Think of crypto markets as the first ten years of a company’s tradable assets after an IPO (initial public offering; crypto is still so young that we haven’t reached mass acceptance!). During those early, formative years, few traders referred to as “whales” can combine to hold over 70-80% of a given asset. With this massive control of a market, we are subject to expansive amounts of market manipulation, or the deliberate driving of a price up, down, or kept in one general area. This idea is extremely important to understand as it gives increased credence to the merits of charting and projecting price movements! It also ties everything together in regard to impulse waves, or the direction and magnitude of price movements. The reasoning behind this claim is rooted in epistemology and crowd psychology, in that these handful of traders that own majority of the available assets of a particular coin are concerned with more than simply seeing the price of their asset increase; their goals are twofold: they want to accumulate more of the asset in addition to raising the price. With this knowledge, we can begin to understand things like buy walls (massive buy orders placed on books), sell walls (massive sell orders placed on books), impulse waves (discerning the direction and magnitude of a movement in addition to identifying a timeframe for when an asset might see these price movements) and charting patterns (typically an area of trading referred to as an “accumulation phase,” or “consolidation phase”).
Impulse Waves
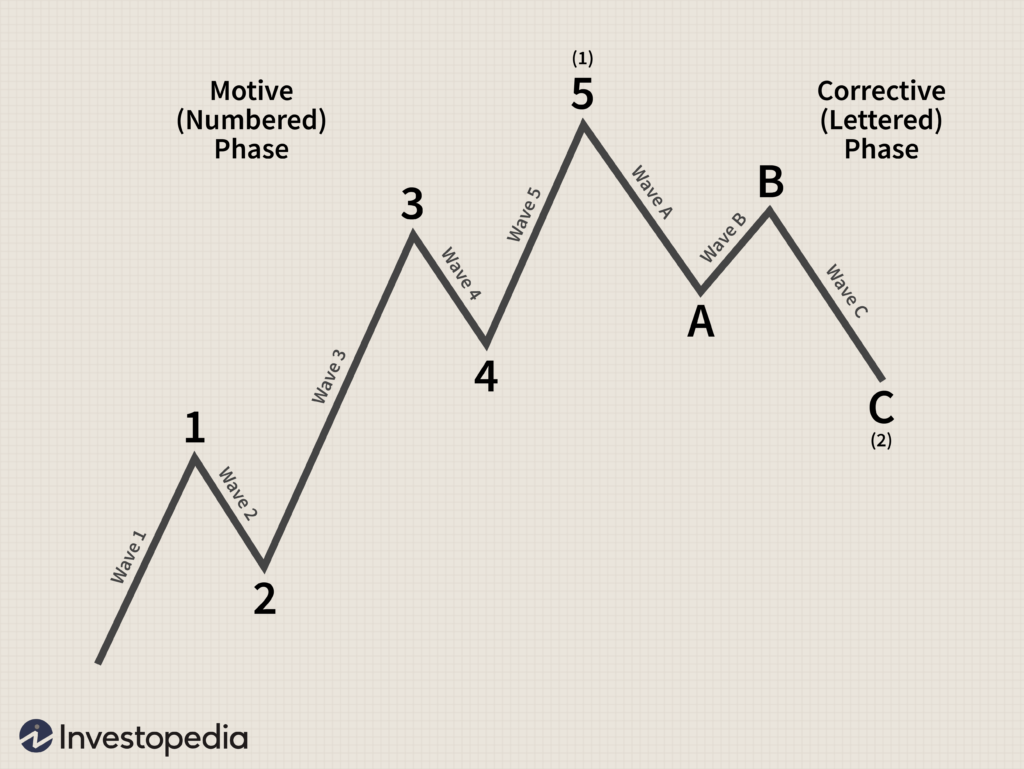
This brings us back to the discussion on Fibonacci. Impulse waves very often can be measured by comparing the magnitude of previous impulse waves, depending on the wave count (again, these principles are found in “Elliott Wave Principles”). Impulse waves that follow an established trend (go up when the price movements of an asset are moving up, as in a bull market, or go down when the price movements of an asset are moving down, as in a bear market) are numbered as Wave 1, Wave 3 and Wave 5. Corrective waves go against an established trend and are numbered Wave 2 and Wave 4. After a full five-wave impulse, assets generally see sharp corrections. This correction happens through either a five-wave accumulation trend or a three-wave correction, labeled as an “ABC” correction, where Wave A is a movement against the trend, Wave B is a temporary bounce with the trend, and Wave C is the final price movement against the trend.
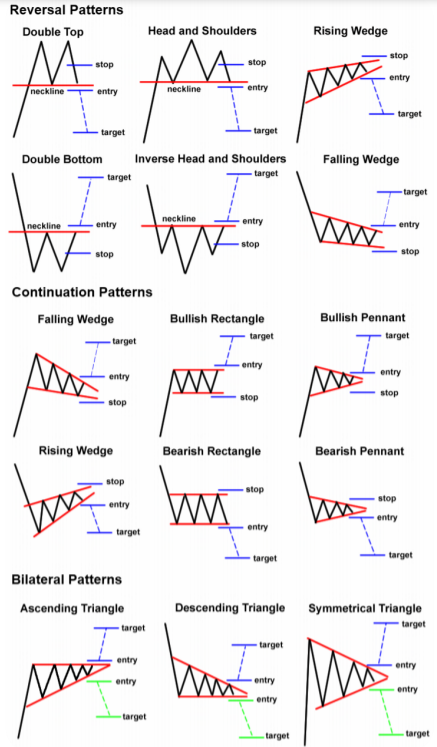
Swing trading is the practice of diagnosing which wave of charting a particular asset is currently in, projecting the next movement of said asset in both direction and magnitude, and entering or exiting a position in accordance with those findings. The areas of a chart I focus on in swing trading are Waves 3 through 5 (because we already have a unit of measure to compare price movements to with Wave 1 and 2 being completed), accumulation patterns (wedges, rectangles, flags and pennants), and ABC corrections. The overarching reasoning behind this idea is due to the fact that these areas of price movements are more predictable and can be more accurately measured through charting and Fibonacci. Let’s break this down a little further. Per Elliott Wave Theory and Fibonacci ratios, Wave 3 cannot be the shortest impulse wave and typically is 1.618 or 2.618 times larger than Wave 1. Corrective waves (Wave 2, Wave 4, and Waves A and C) hit one of three values (0.382, 0.5, or 0.618), measured via the magnitude of the preceding impulse wave (Waves 2 and 4 are typically within the 0.5-0.618 range while Waves A and C are typically in the 0.382-0.5 range). So, by measuring the magnitude of the preceding impulse waves, assuming we have an accurate count on a chart, we can calculate buy or sell targets for our swing trades (if you’ve followed me on Twitter over the last four months or so, you’ll see that my targets through these methods have been extremely accurate). For a more detailed explanation of and discussion on Elliott Wave Principles/Theory and Fibonacci Ratios, I highly recommend reading the aforementioned document/study; this course is intended to provide my methods of utilization of these principles, not provide 120 pages of a full breakdown of the fundamentals!
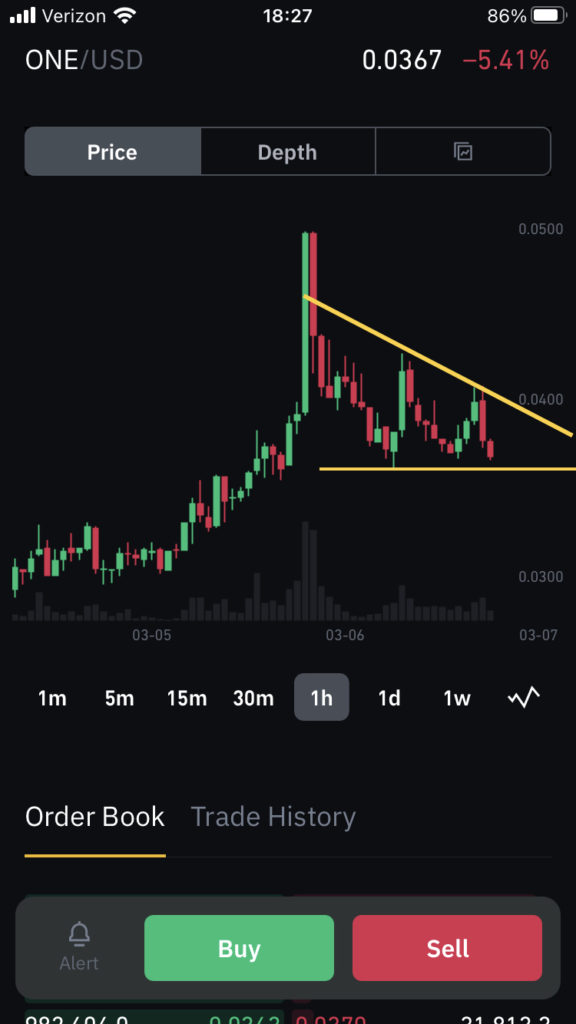
The absolute easiest areas to swing trade on a chart are the accumulation windows (the rectangles, wedges, pennants and flags). These areas typically see the quickest returns and generally see high magnitude movements in short periods of time. My personal approach is to wait until the trend has been established (after the price movements have established one iteration of floor and ceiling) so we’re not completely guessing as to what accumulation formation is developing. As you can see in the picture below, these windows provide high-confidence floors and ceilings for predicting price movements and give us what I call “trend supports” and “trend resistances.” With this knowledge, we can buy at trend support and sell at trend resistance, typically banking 5-10% profits in each iteration.
The beauty of this course is most of that cryptocurrency discussion earlier literally means nothing to us. All we care about are price movements and projecting future movements. So, what is important in swing trading?