Stack Your Stack ⚾ June 27
>>>Larejo123
What is the best way to predict future performance? One could argue the best way is to rely on past performance. No matter the statistical category the only indisputable data we have is data from the past. So naturally, where most of us end up is that the best way to predict short-term future performance is by analyzing short-term past performance.
Short-term data in sports can be called streaks, and hot or cold streaks end up being a solid basis by which our predictions are formed. Recently, I decided to read The Book: Playing the Percentages in Baseball, written by three industry veteran MLB data scientists (Tom Tango, Mitchel Lichtman, Andrew Dolphin). This book’s overall intent is to guide baseball managers to make decisions based on strong probabilistic outcomes. And while the book (pun intended) doesn’t make many specific conclusions (the best chapter is on an optimal batting order), there’s a fascinating chapter on hot streaks for batters and pitchers.
I’ll spare you all the finer details, but the team analyzed four full MLB seasons of data from 2000-2003 (even though it’s an old sample, in my opinion the data set is large enough to make the year the data was collected irrelevant), and concluded the following as it relates to predicting pitcher and hitter performance following a streak:
“Knowing that a hitter has been in or is in the midst of a hot or cold steak has little predictive value. Always assume that a player will hit at his projected norm (adjusted for the park, weather, and pitcher he is facing), regardless of how he has performed in the very recent past.” (Tango, p.63)
“If a pitcher has pitched exceptionally well for four consecutive appearances, we can expect him to continue to pitch better than his norm for at least one more appearance.” (Tango, p. 70)
Before I read this chapter, I was all excited in thinking this was going to be the holy grail of predicting MLB player performance. And then the wind was promptly sucked out of the room when the conclusion on hitters is we cannot use a hot streak (defined in The Book by many parameters, but mostly a 5-game sample above a certain wOBA) to predict how the player will perform in the next game.
Pitchers, on the other hand, do have some predictive value. Recent performance of 4 appearances (for starting pitchers, that’s 20 days usually) can be used to show the next appearance should dictate a .3 run improvement or decline (depends on hot or cold) in runs allowed. Over a long season, a .3 change in ERA can make an average pitcher a very good one.
I bring this up in this article today for a few reasons. First, to tell you it’s expected and normal that we won’t be able to really predict what will happen in today’s games. If even the most recent data which shows a strong trend (hot/cold streaks) doesn’t accurately predict hitting outcomes, then what and where can we turn to? And second, to mention that pitcher data is more predictive than hitter data. We know how difficult it can still be to predict pitcher performance, but there is less variance on the pitching side (with less outings/appearances than hitters each season) which, in my opinion, leads to a higher predictive probability. This doesn’t make it easy, it just leaves the door open for the possibility of using data properly to forecast.
With all this being said, and because you came here to read a DFS article on today’s slate, let’s go right ahead with our usual recent MLB stats to look into today’s future outcomes. I’ll note that based on the time horizons in the streak data above, I’ve adjusted my data sets to reflect 21 days for pitchers and 10 days for hitters. Let’s go!
Sunday, June 27th
Probable Starting Pitcher performance data (over the past 21 days)*:
- Hard-hit %: Tarik Skubal 50.9 // Chi Chi Gonzalez 50.8 // Jorge Lopez 46
- Barrel %: Max Scherzer 18.2 // Lopez 14.3 // J.A. Happ 14 // C. Gonzalez 11.9
- SIERA: Happ 5.62 // Jordan Lyles 5.59 // Eric Lauer 5.05 // Kyle Muller 4.75
- SIERA-ERA: Sandy Alcantara 2.66 // Marcus Stroman 2.32 // Scherzer 1.99 // Zack Wheeler 1.56 // Gerrit Cole & Jordan Lyles 1.18
- Fly Ball %: Scherzer 63.6 // Happ 50 // Eduardo Rodriguez 47.3 // Lyles 46.3
- Walk %: Lauer 14.3 // Scherzer 13.6 // Brady Singer 11.6 // Skubal 10.6
*Muller has only a 5-inning sample size while the Pirates’ Max Kranick will make his MLB debut and is excluded from this data set
The hard-hit pitchers aren’t much of a surprise as they should lead to offenses with the most ownership today (Skubal vs. Astros, Gonzalez vs. Brewers, and Lopez vs. Jays). The other pitchers in poor form lately would be Lauer (vs. Rockies), Lyles (vs. Royals), and Happ (vs. Indians). From this, the Brewers-Rockies jumps out as a top game stack. We could also point out Scherzer’s surprise rank on these lists with his high fly balls and barrels but that’s always Scherzer. He’ll give up some home runs, but the strike outs will be there too. The SIERA-ERA category over this time span is negligent, mostly. Alcantara should see some regression, but he’s been rock solid this season and even a 2.66 run difference is nothing major.
Team Batting Leaders (over the past 10 days, teams on this slate only):
- Hard-hit %: Nationals 44.8 // Yankees 44.5 // Twins 44.3 // Astros 44.1
- Barrel %: Yankees 10.9 // Braves 10.4 // Astros 10.2 // Angels 10
- ISO: Astros .228 // Phillies .199 // Angels .198 // Yankees .197
- Fly Ball Rate: Red Sox 41.7 // Braves 40.8 // Orioles 40.4
- BABIP (bottom three): Cardinals .223 // Mets .234 // Marlins .242
- HR/FB (bottom three): Cardinals 6.5 // Red Sox 8.2 // Reds 9.5
From this data, another possible game stack emerges with two offenses who should be seeing better outcomes: Yankees and Red Sox. The problem is Gerrit Cole, so I’ll leave the Yankees on my list for now with their HH and Barrel rates. The Angels also come on this list with their high ISO and top-4 Barrel rate, without Mike Trout. They face Ryan Yarbrough and the Rays Sunday. The Cardinals are the third offense I want to call out. They are facing a rookie making his debut in Kranick and their offense is due for some better luck (last in MLB in BABIP and HR/FB percent).
I mentioned the Blue Jays and Astros taking up a chunk of Sunday’s ownership. As of now, my planned exposures will sit with the Brewers, Rockies (only in game stacks), Yankees, Blue Jays, and Cardinals. As such, I’ll call out below how I’m filling my hitter stacks.
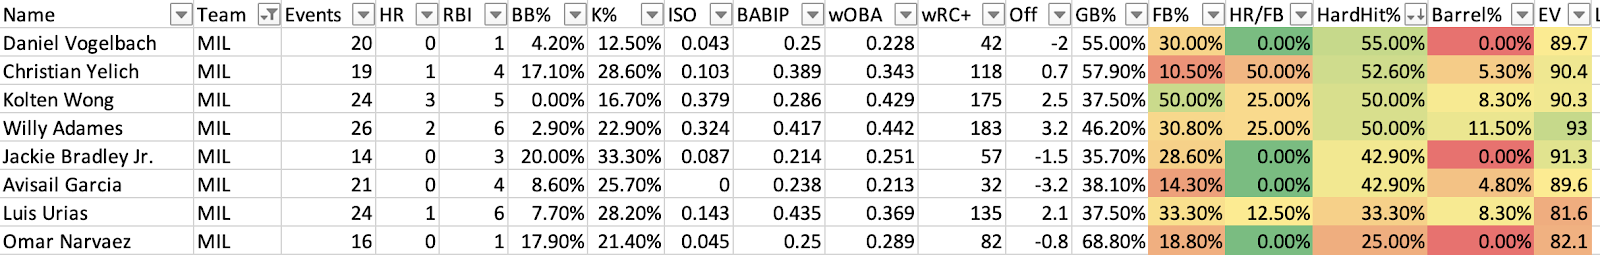
Milwaukee Brewers vs. Colorado Rockies (Chi Chi Gonzalez)
Christian Yelich may be heating up with his home run Saturday. Daniel Vogelbach, Kolten Wong, and Willy Adames all sit above 50% HH rates. Avisail Garcia would be my last in here with his hot game Saturday too. The barrel rates across the board are low but Chi Chi’s high rate given up could correct this trend.
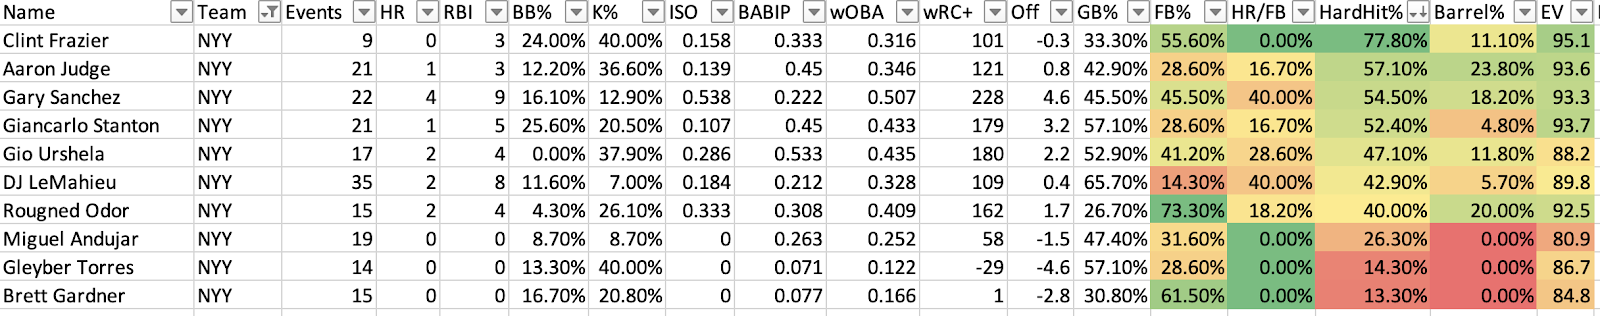
New York Yankees at Boston Red Sox (Eduardo Rodriguez)
Aaron Judge is the priority with his 57% HH rate and over 23% barrels with only one home run in the past 10 days. Gary Sanchez would be next with very close but just behind rates on both these metrics compared to Judge. Stanton, Urshela, and Clint Frazier (77%!) boast +47% HH rates as well.
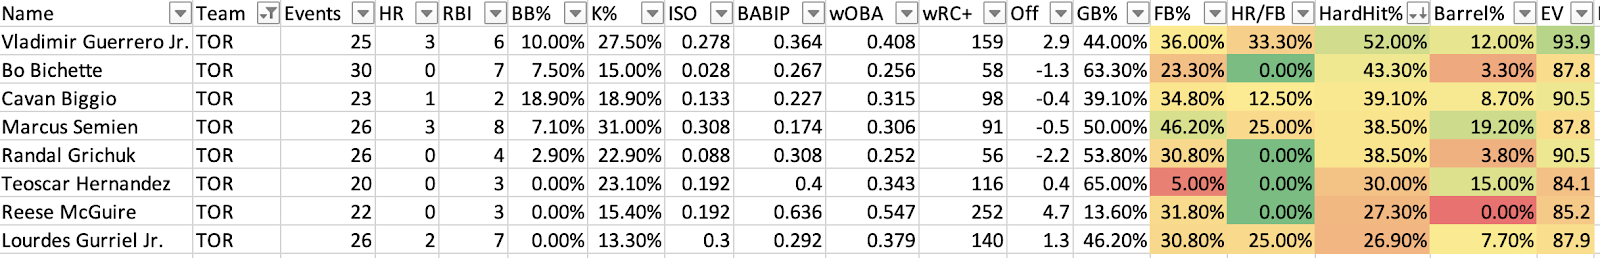
Toronto Blue Jays vs. Baltimore Orioles (Jorge Lopez)
After Saturdays 12-run outburst, no offense is arguably hotter than Toronto heading into Sunday. Vlad Jr. almost has to be included though stacking the Jays without him would be a nice way to differentiate. I wouldn’t deviate from the top-6 here (Vlad, Bichette, Biggio, Semien, Grichuk, Teoscar).
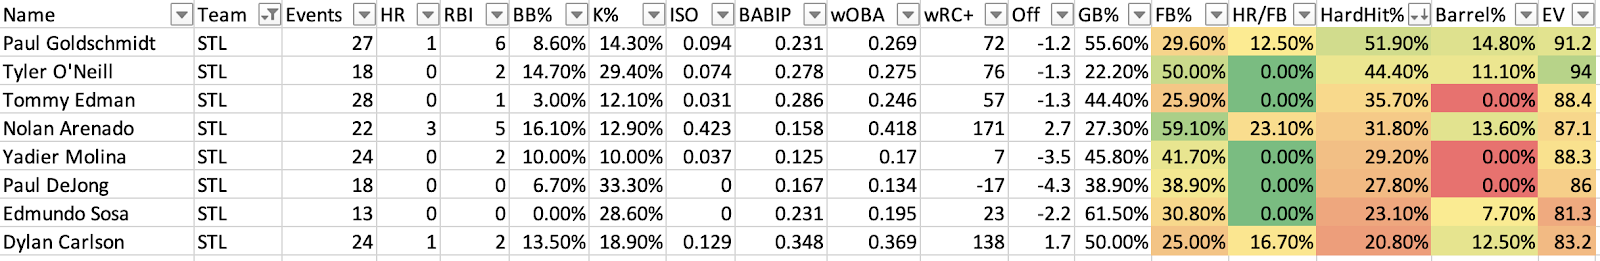
St. Louis Cardinals vs. Pittsburgh Pirates (Max Kranick)
The underlying numbers here aren’t great, and we knew that coming in based on the team’s lagging stats we saw earlier. Goldschmidt and O’Neill lead the way. Arenado and Edman would be next. Carlson has been seeing the ball better recently with a home run Friday, and his barrel rate of 12.5% should be noticed.
Thanks for hanging with me! I hope this helps you get started in your process. Good luck today!