The Field
How Chalk Forms
Last lesson ended with a promise to show you where the crowding comes from. Start with the scale of the thing that needs explaining. In the median large-field showdown contest, the middle of my data, the most-owned player appears on 76.2% of all entries. Three of every four lineups in the field, holding the same player. The record is 94%.
Of course, showdown is only one game, but classic isn’t immune. Its median top player lands on 40% of entries. This lesson is about where that agreement comes from, and what I found when I tested the two most popular theories about beating it.
Where chalk comes from
The crowd’s favorites are called chalk, the heavily-owned players, the consensus. The reflex explanation for chalk is that the crowd is lazy. Sheep chase last week’s points. Everyone copies everyone. But look at the raw materials. Every entrant on a slate looks at the same salaries. Reads the same injury report. Uses projections that mostly come from the same source, the Vegas lines. Follows the same handful of touts with the same player and game takes. Chalk is what happens when a hundred thousand people independently process the same information with broadly similar logic. It isn’t herding. It’s convergence.
There’s a book people reach for whenever a crowd all does one thing (Charles Mackay’s Extraordinary Popular Delusions and the Madness of Crowds, the 1841 tulip-mania book), and chalk looks like it belongs in it. But it’s the opposite specimen. A mania spreads person to person. Chalk arrives at each person separately, computed from shared inputs. The ownership sheet is the crowd at its most sane, which is exactly what makes it hard to beat.
I’ve spent fifteen years around markets, and this is how a price forms: many strangers, shared information, similar incentives, one number. Ownership is a price, and two things follow. First, whatever everyone knows is already in it (in finance that’s called the efficient-market hypothesis). Second, and keep this one in your pocket, the money in any market isn’t always in having better information. Sometimes, it’s in having different information. A modest fact the crowd doesn’t hold can beat a brilliant one it does. The two questions you’d ask of any price are the ones I measured, how sharp it is and whether a rule of thumb can beat it.
Attention doesn’t scale
Raw counting first, across the same 771 large-field contests from the first lesson. In the median showdown contest, the five most-owned players fill 48% of all the roster slots. Five names, nearly half of everything. On a full Sunday slate, the top five hold 17%. The obvious explanation (one game simply offers fewer players) is only half the story, and the measured half is better.
First, the pool. Scrub the data of its noise (chiefly forgotten placeholder lineups, parked with throwaway names and never rebuilt) and the real pool in a showdown contest is about 25 players the field meaningfully uses, counting everyone rostered by at least 1% of entries. That’s a step past the first lesson’s sane-person list, not just the ones you’d actually roster but everyone the crowd does.
Now extend that to a Sunday main slate the way any reasonable person would. Call it eleven games at 25 real players each, so the pool should run about 275. Measured, it’s 123. Per game, that’s eleven. What changed is what the crowd does with them.
Put a game alone on the showdown slate and the field works it about 25 players deep. Put the same game on a Sunday main slate and the field gets eleven deep. Even a three-game holiday slate already drops to about sixteen a game. The crowd doesn’t bring ten slates’ worth of attention to a ten-game Sunday. It brings roughly one, and spreads it thinner.
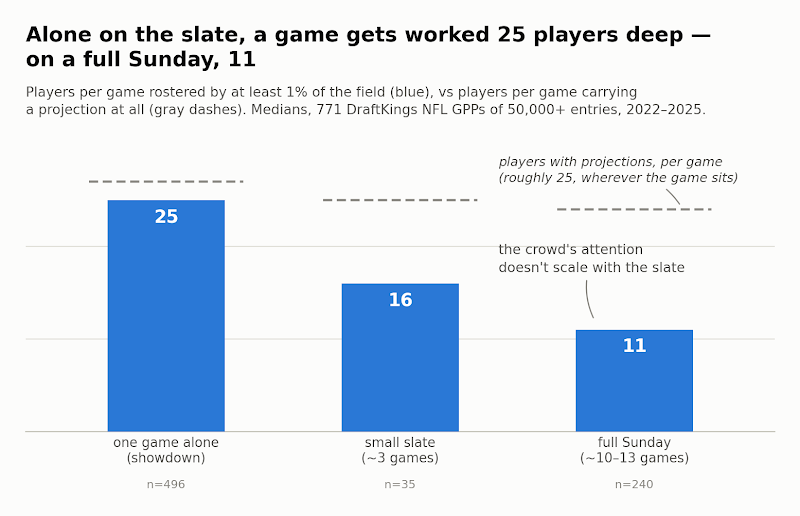
Showdown is concentrated because the same crowd pours a full field’s worth of attention and money into one game’s 25 usable names, and the top handful soak up nearly half of every roster slot.
One seeming contradiction with the first lesson. Classic almost never duplicates, yet its games get used shallowly. Both are true because concentration is about single players; duplication is about whole lineups. Nine slots drawn from 123 usable names still explode into more combinations than any crowd can fill. Six slots drawn from 25 don’t. And field size, one more time, does none of the work. Fifty thousand entries or half a million, these numbers barely twitch.
The captain test
In showdown everybody has a theory about the captain, the roster spot that scores at one-and-a-half times. Theory one: winners get contrarian at captain. The chalk captain is where dreams go to die, fade him. Theory two, the backlash: the chalk captain is chalk because he’s the best player, so winners take the obvious guy.
I tested both across 484 showdown contests (8,400 winning entries). Measured against their own contest’s captain-ownership distribution, winning captains sit at the 45.7th percentile, where 50 would be dead average. The field’s typical captain carries about 11.9% ownership, and winners’ captains 11.2%. Lay the two distributions over each other and they match. But the spread is enormous. A tenth of winning captains came from the bottom of their contest’s ownership scale, another tenth from the top.
Both theories die in the same dataset. Winners don’t fade the chalk captain, and they don’t ride them either. They captain like the field captains, all over the map, which is what “no signal” looks like when you finally count it.
A price sheet, not a leaderboard
The ownership market is sharp. It concentrates for structural reasons, and the most-tested rule of thumb for beating it turns out to be noise. The crowd is not the sucker at this table.
But nothing above says the crowd’s favorites are free. It says the opposite. When most of a field holds the same few players, lineups collide, and the last two lessons showed you what collisions do to what winning pays. This lesson leaves you with one change. When the ownership numbers come out, don’t read them as a leaderboard of who’s good, because the market already agrees on that. Read them as a price sheet: what holding each player costs, and whether anything on it is mispriced.
On the player side, different information is nearly extinct. Everyone reads the same projections off the same lines. On the field side (what the crowd is doing, what it costs, where it’s piled up), most entrants aren’t using the information correctly at all. That side is where different information still exists, and it’s the side this course teaches you to read.
Up next: that cost is called duplication. It arrives after lock, and the strange part is that you can read most of it in advance. Next lesson prices it.
Going deeper: the 84% trap
Somewhere in the wild you’ll meet a statistic shaped like this one. In my 484 showdown contests, 84% of the captain slots on the best-finishing lineups belong to players owned by more than 30% of the field. On its face, that settles the captain debate. Winners captain chalk, overwhelmingly.
Compared to what, though? Those same finishers fill about 65% of their other five slots with such players, and so does the whole field, because on a one-game slate the heavily-owned are most of what a sane roster can hold. The 84% describes how showdown lineups are built, not how they win. Compare winners to the field instead of to your intuition, and the effect collapses back into the main line’s 45.7th-percentile null.
Statisticians call this reading a marginal number as a conditional one. The antidote transfers far beyond DFS. Whenever someone shows you “winners do X,” ask what share of the losers do X too. If the numbers match, you’ve learned how the game is built — not how to win it.