The Field
When to Embrace Chalk
One rule of thumb has permeated DFS content more than almost any other. Winning lineups land in a band of total ownership, something like 80% and 125% for classic. The sweet spot. You’ve probably heard a version of it. It gets repeated as settled fact. Last lesson ended with a loose thread, the obvious, over-owned chalk finishing slightly ahead of its share. This lesson tests the sweet spot against all 112 million entries, and picks up that thread.
Where winners actually sit
The measurement uses the total you already know, cumulative ownership, summed the way the duplication lesson summed it. Line up every entry in a contest from the most contrarian total to the chalkiest, and find where the winning entry stood in that line. Do it for every contest.
The winner stood, over and over, just below the middle of the line, and everywhere else. In classic, the typical winner sat a bit under the field’s midpoint, and winners were above that midpoint in 42% of contests. In showdown they lean a little further contrarian, but a fifth of showdown winners came from the most contrarian tenth of their field, and nearly a tenth came from the chalkiest tenth. Winners are not ownership extremists in either direction. In fact, based on this lens, there’s no ownership signature that marks a winner at all. Shuffle the winning lineups back into their fields and look only at the totals, and you could not pick them out again.
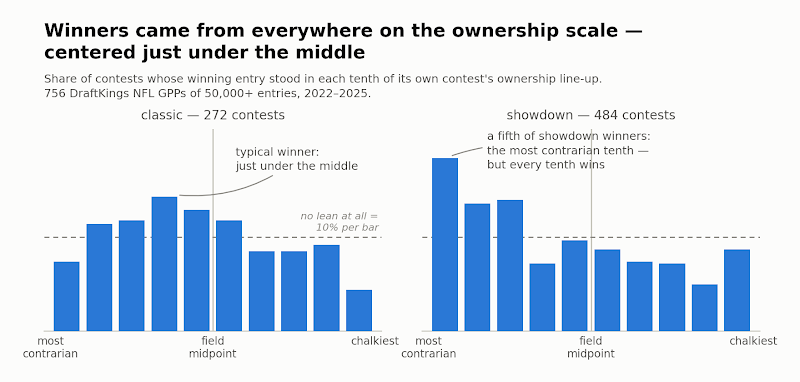
The sweet spot, measured
Now the famous band. Take every classic lineup whose total landed between 80% and 125%. Those lineups make up 43.5% of winners, which sounds like confirmation until you count the other side. They also make up 44.4% of the whole field. Winners land in the band at the same rate as everyone else does, so being in it tells you nothing about winning. The rule feels true because most lineups simply sit there. It’s the same trap the chalk lesson’s footnote defused, a statistic about winners that’s really a statistic about everybody. Even on full Sunday slates, where the claim was born, the band holds 55% of winners against 49% of the field, a lean rather than a rule. And it’s classic-only besides. Showdown totals run so much higher that virtually every showdown winner in four seasons sits above 125%.
Simpson’s paradox and games with names
A flat average has a known failure mode, famous enough to have a name, Simpson’s paradox. Pool different situations into one average, and the average can erase, or even reverse, what’s true inside every single one of them. The flat chart above pools four seasons of slates, shootouts and slogs, blowouts and nail-biters, all in the same bars. If winners build one way in one kind of game and the opposite way in another, this is exactly the chart you’d get. Everything cancels.
This is where the machine comes back in, because that flat chart is roughly where its education on the field began.
To test the suspicion, it needed to know what a football game even is. We taught it eight seasons of closing Vegas lines and final box scores, 2,227 games, every one played from 2018 through 2025, and it learned to name what each game had turned into. Not just the final margin, but what formed the game script and how the points were scored. The first version left too many games in a miscellaneous pile, so we tightened it until the names fit. It turns out five names cover football: the shootout (close and high-scoring), the grind (close and low), the balanced game in the middle (the most common by far), and two kinds of decisive wins, one driven by the passing game, and one by the run game and defense. Why exactly five is a simulation story. More on that later.
Everything that follows in this section is measured in showdown, where the one game is the whole slate and understanding game scripts is paramount. On a classic slate a dozen games run at once, every script potentially represented somewhere. The game you built your lineup around still has to deliver, but no single script decides the whole day. That is exactly why game types matter most where there is only one game.
Next, we re-asked this lesson’s question inside each type, and the flat chart cracked. The winner’s typical spot ranges twenty points across the five. Three of the five types wobble from season to season, but the two ends hold everywhere we looked: in the grinds — close, low-scoring games — winners were the most contrarian builders of any game type, while captaining right with the crowd. Two levers, moving independently, in a pattern that only appears once games have names. This whole course measured one lever at a time, averaged across every kind of game. The averaging is exactly what made winners look shapeless.
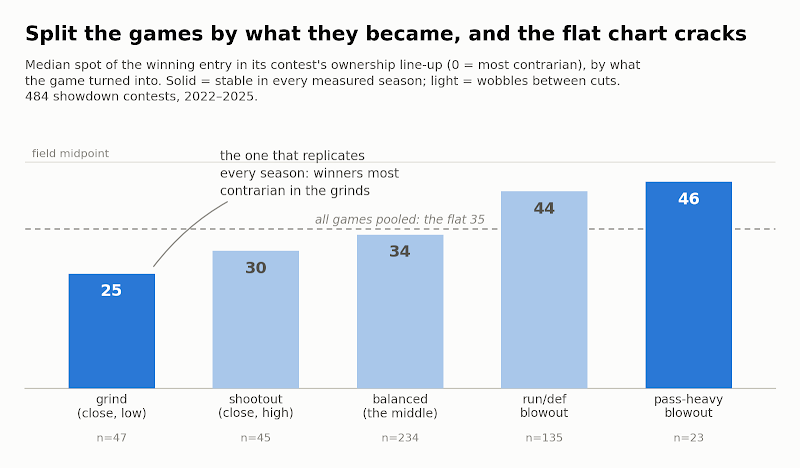
And before you ask the obvious question, yes, a game’s type is only known when it’s over, so none of this is a pre-lock signal by itself. Whether a grind can be seen coming is a different and much harder question, and it’s precisely where this series goes next.
Closing the ledger
Everything this course counted comes down to four facts. The crowd’s favorites are usually the right favorites, and chalk is what shared information looks like. What chalk actually costs is uniqueness. In classic, almost nothing until your total nears the wall, which sits higher than the rule of thumb says. In showdown, always. Low-owned players don’t hit more than their price. And winning lineups look ordinary until you know the game scripts. Embrace chalk when the crowd’s reasons are your reasons. The market is sharp, and standing apart from it on principle is a cost, not an edge. Spend your difference where it’s cheap. In classic, that’s below the wall. In showdown there is no quiet end. Even the most contrarian totals get copied by the dozen, so your difference has to come from construction, the captain call and the pieces around it, not from discounts. And let the field beat itself, over-copied chalk splitting checks at one end, dead discounts giving away points at the other.
Close the leaks the field pays every single week: the split checks, the dead pivots, the difference bought at full price. In a game this sharp, those leaks are the margin, and unlike every rule of thumb this course has buried, this margin has been counted.
One last thing. The machine’s answer to a slate isn’t a prediction — it’s a rehearsal. It replays the whole day ten thousand times: every player’s full range of outcomes, the way teammates and opponents rise and fall together, the scripts that decide whether a game turns into a shootout or a grind. Even the crowd you just spent a course counting gets rebuilt inside it. How all of that gets built, what it got wrong at first, and what it started to see once games had names is the next course. It’s called Ten Thousand Sundays, and it’s where things start to get really interesting.