The Field
Leverage, Measured
No word in DFS sells more content than leverage. Most of that content leans on some version of the same sentence. The low-owned player is the sharp play, because when he hits, you leapfrog the whole field. Strip the sales language and the claim is that players almost nobody owns show up in winning lineups more than their ownership says they should. That claim has a number. As far as I can tell, nobody selling it had ever gone and gotten it, or checked if it was actually true.
Counting the claim
One note before the count. Last lesson summed whole lineups. This one goes back to single players, grading every roster slot on its own.
The measurement is simple to say. Take the best finishers in every contest (the top sliver of entries, the ones the big checks went to) and look at every roster slot they filled. Sort those slots by how owned each player was: under 5%, 5–15%, 15–30%, over 30%. Do the same for the whole field. If the leverage pitch is true, the winners’ rosters should carry noticeably more of the under-5% stuff than the field’s do. I ran it across 756 large-field contests, 112 million field entries and about 24,000 top finishers.
The table is flat
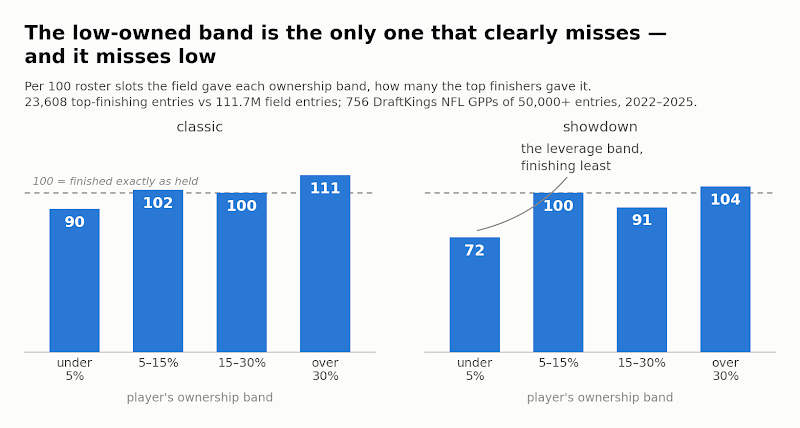
For every 100 roster slots the classic field gave to under-5%-owned players, the best finishers gave them 90. In showdown, 72. The cheap end under-delivered, in both games.
And the rest of the scale mostly holds. The over-30% chalk band nudges ahead (111 in classic, 104 in showdown), classic’s 5-15% band beats its share by a hair (102), and the biggest wobble anywhere else is showdown’s 15-30% band at 91. The only band that misses low in both games is the one the leverage industry is built on.
What leverage has left
There were always two different claims hiding inside “leverage,” and only one of them just died. “The low-owned player hits more than his ownership says” — that one’s dead. “When he hits, you split the check with fewer hands” — that one is just arithmetic, and last lesson you priced it: fewer copies, smaller crowds, bigger shares. But low ownership never made anyone hit. It makes hitting pay better.
That distinction also exposes the most common counterfeit, the price pivot. Similar salary, worse player, lower ownership, rest of the roster untouched. Look at what that actually buys. In classic, uniqueness below the wall was already free, so you paid points for something you had. In showdown the swap does thin your copies. But the bigger check only arrives if the discount player outscores the one you left, and that is exactly the bet the table above says doesn’t pay. Put simply, a pivot isn’t leverage.
Where real leverage is
If single-player discounts aren’t it, what’s left is difference at the level where the crowding happens, the whole lineup. This whole course has been telling you the field collides on whole rosters, not on players. Being different in a way that matters means building a combination the field isn’t building, out of players you actually want.
And combinations behave nothing like single players. One measured example. Take the two most expensive players on a classic slate. Each is usually popular on his own. But popular apart is not popular together. The salary cap makes fitting both painful, and the field rosters that pair about a third less often than their separate ownerships predict. And that scarcity is not a correlation story. Even when the two stars play in different games (nothing linking them but their price tags) the pair shows up about 40% less often than chance predicts. That flavor is purely structural rarity. Put the two in the same game and you’re also buying their tendency to spike together — correlated upside, which gets a full course of its own later in this series, the correlation masterclass. Either way, nobody downgraded anything. Two good players, individually chalky, jointly scarce. If you can make the rest of your lineup work, that is leverage with nothing sacrificed, rareness bought with structure instead of with worse players. For now, it’s enough to know where to look, at your roster’s shape rather than its discounts.
Whenever someone offers you leverage, ask which claim they’re making. If it’s about the split (or about a combination the field can’t easily build) they’re doing math, and you can check it. If it’s about hit rates, they’re guessing, and now you know what the count says.
Which leaves the strangest fact on the board hanging. The obvious, over-owned chalk finished slightly ahead of its share. So if the cheap end doesn’t out-hit, and the crowded end doesn’t collapse, what did winning lineups actually look like, added up? Next lesson closes the course’s ledger, and a famous “sweet spot” dies on the way.